What is it?
A metal that barely absorbs neutrons, which is why nuclear fuel rods are wrapped in it, and whose sand form is a foundry and ceramics staple.
Why does it matter?
Zircaloy cladding is a nuclear reactor's first containment barrier. Making it requires separating zirconium from chemically near-identical hafnium.
Where it is in the Earth
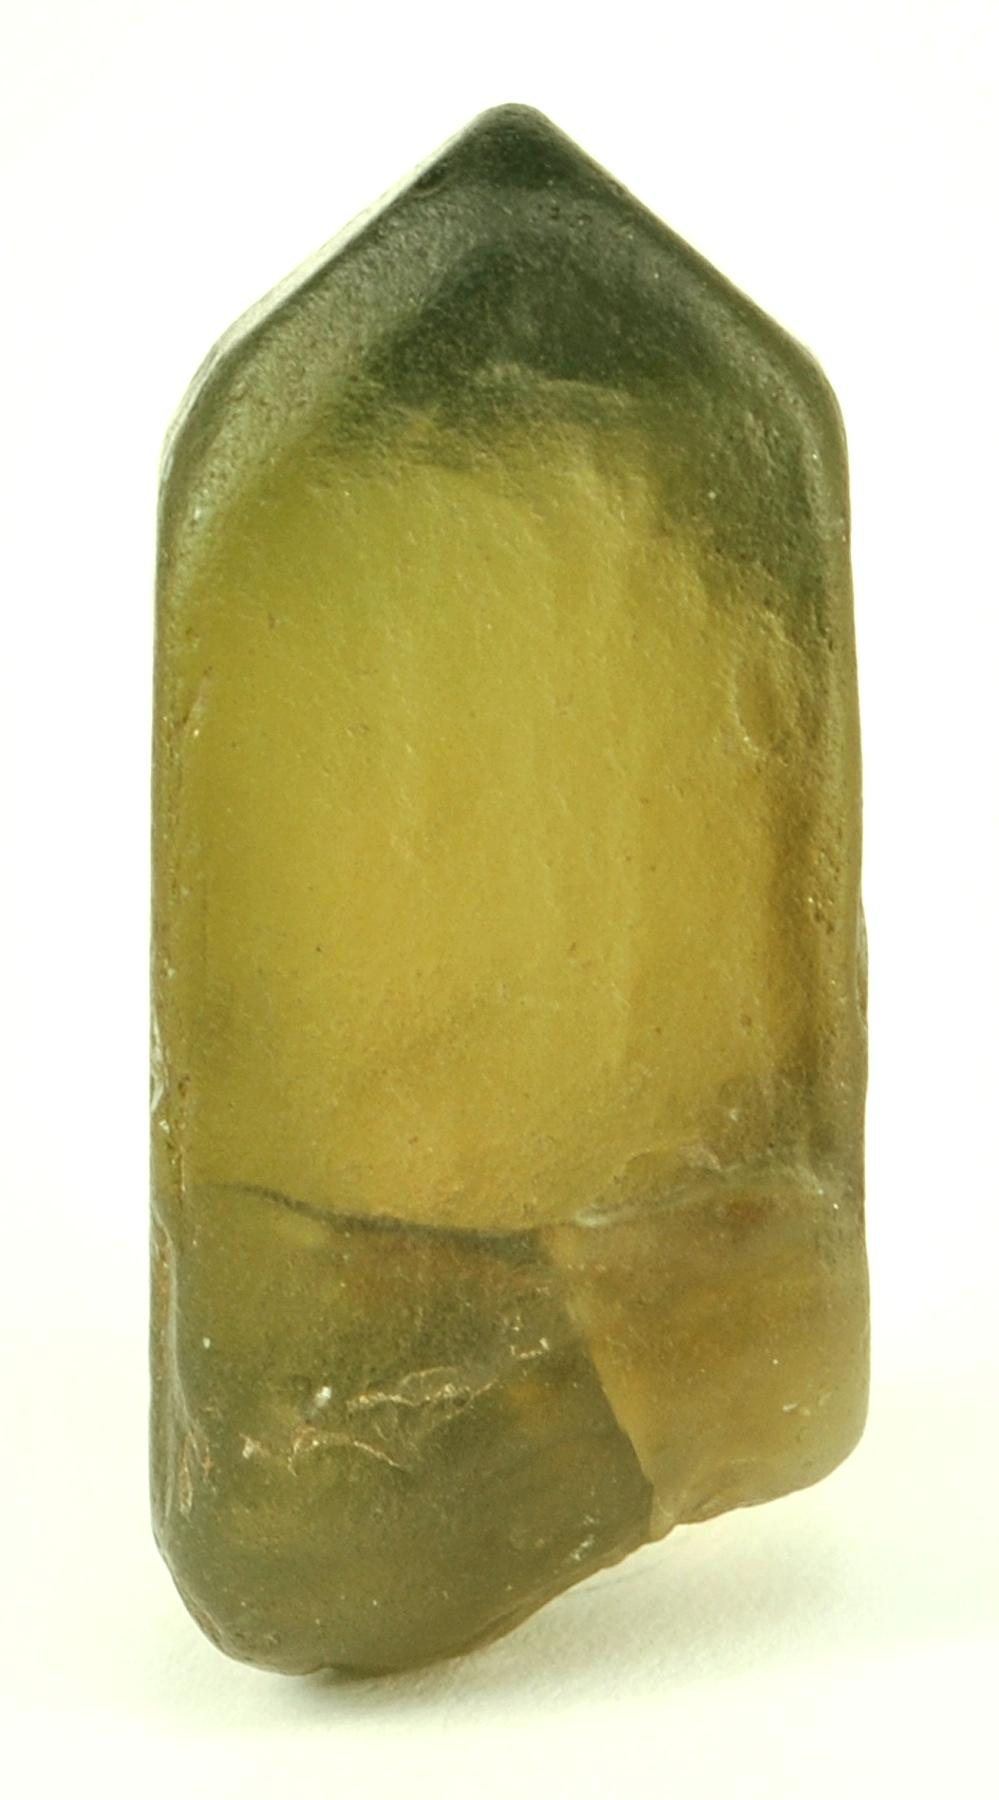
Zircon — the mineral zirconium silicate (ZrSiO4) — forms in igneous rocks, particularly granites and syenites, where zirconium concentrates in the melt as other minerals crystallise around it. Because zircon is chemically inert and physically hard, it survives the long journey from its parent rock into river systems and eventually to coastlines. Wave and wind action do the separating work: minerals are sorted by density, and zircon, being noticeably denser than common quartz and feldspar, settles out in the same beaches and dune systems that accumulate other heavy minerals such as ilmenite and rutile. These accumulations are called heavy-mineral sand deposits, or simply mineral sands.
The deposits that dominate the production tables today — in Australia, South Africa, Mozambique, and along the West African coast — are relict shorelines, meaning ancient coastlines that have since been buried or lifted above sea level by geological movement. Australia's vast reserves reflect the fact that the continent's old, stable geology has produced granitic source rocks over enormous areas, and that ancient drainage systems funnelled the eroded material into long-lived coastal environments where sorting could proceed over geological time. The concentration of zircon in these deposits is usually modest in percentage terms but recoverable because the sand is loose and near-surface, requiring no blasting or underground work.
Zircon is the sole commercial source of zirconium. There is no significant hard-rock mining of zirconium-bearing ore, and no brine or sedimentary source contributes meaningfully to supply. This means the entire zirconium supply chain depends on the health of the mineral sands industry, which itself produces zircon alongside titanium minerals — a relationship that shapes the economics of both commodities.
Getting it out
Because mineral sand deposits are unconsolidated — essentially beach sand — the mining method is almost always a form of open-cut operation, either dry mining with scrapers and bulldozers or, more commonly at large operations, wet mining using a floating dredge. A dredge sits in a pond of its own making: it excavates the sand ahead, processes it aboard the vessel, and stacks the coarse waste material behind, so the pond migrates slowly across the orebody. This approach works well where the water table is shallow and the ground flat, which describes most coastal mineral sand terrains.
The product leaving the mine is called heavy-mineral concentrate, or HMC. It contains zircon alongside ilmenite, rutile, leucoxene, and smaller quantities of monazite. The zircon content of the raw sand is typically a fraction of what ends up in the HMC, because the concentration step on the dredge or in a dry-mining plant uses gravity, magnetic, and electrostatic separation to discard the abundant low-density quartz and feldspar before any of the valuable minerals are separated from each other. What counts as an economic grade of zircon in the raw sand is not a fixed number; it depends on the total heavy-mineral content, the mix of valuable minerals in that HMC, the depth and thickness of the ore body, and the cost of moving sand. Because mining is effectively moving large volumes of loose material, the ratio of waste sand to product is high, though the waste is generally benign — returned sand, not chemically toxic tailings in the conventional sense.
A complication specific to mineral sands is the presence of monazite, a phosphate mineral that carries thorium and uranium. Because of their radioactivity, monazite-bearing streams must be managed carefully, and in some jurisdictions regulations constrain how much can be stockpiled or sold, which affects the economics of the entire operation even though monazite is a relatively minor component of the HMC.
What pulls on it
Zircon sand consumed in ceramics — principally as an opacifier in tiles and sanitaryware, and as a refractory in foundry casting — accounts for by far the largest share of demand. Zircon makes tiles white and opaque, and it stabilises the moulds into which molten metal is poured because it tolerates rapid temperature change without cracking. This means that construction activity and automotive and aerospace casting volumes are the primary drivers of the zircon market, and those are cyclical. When housing construction slows or car production falls, zircon demand softens, as the price series illustrates: the peak around 2022 reflects a recovery in construction and manufacturing activity, and the subsequent easing tracks cooling demand from those sectors.
The nuclear application is a much smaller share of total zirconium demand by volume, but it is qualitatively different from the ceramics market because it requires the highly processed, hafnium-depleted metal rather than the sand. Demand for Zircaloy tubing is governed by reactor construction and refuelling schedules, not construction booms. A pressurised-water reactor requires between 20 and 40 tonnes of zirconium per gigawatt of capacity in cladding tubes and structural grids, and fuel assemblies are replaced on cycles of one to two years, so operating reactors generate a steady ongoing call on the metal. A global expansion in nuclear generating capacity — whether for decarbonisation reasons or energy-security reasons — would increase demand for nuclear-grade zirconium, but this effect unfolds over the decade-scale lead times of reactor construction, not quickly.
For demand to change sharply in either direction, something structural would need to shift. A sustained collapse in ceramics construction output globally, or the widespread adoption of a different opacifier that matches zircon's optical and chemical properties at lower cost, would remove the largest pillar of demand. Conversely, a rapid build-out of new reactor fleets would increase demand for nuclear-grade metal specifically, though the sand market would see only a modest indirect effect given the scale difference between the two end uses.
Where it comes from in the rock
All ore minerals →These are the minerals that actually carry zirconium. A deposit is only an orebody if one of them is concentrated enough to pay for digging it up.
Who produces it
See it on a map →Zirconium mineral concentrates, mine production (thousand metric tons, gross weight)
Zirconium mineral concentrates, mine production (thousand metric tons, gross weight)thousand metric tons 2025 (estimated) World total 1,200 thousand metric tons
USGS Mineral Commodity Summaries 2026 · USGS reports zircon (ZrSiO4) concentrate gross weight, not zirconium metal. · source ↗
Scroll the table sideways for the remaining columns.
| Country | Production | Share of world |
|---|---|---|
| Australia | 400.0 | 33.3% |
| South Africa | 270.0 | 22.5% |
| Mozambique | 160.0 | 13.3% |
| China | 100.0 | 8.3% |
| United States | 100.0 | 8.3% |
| Senegal | 70.00 | 5.8% |
| Indonesia | 52.00 | 4.3% |
| Other countries | 40.00 | 3.3% |
| Madagascar | 26.00 | 2.2% |
| Sierra Leone | 25.00 | 2.1% |
| World total | 1,200 | 100% |
“Withheld” means the USGS suppressed the figure to avoid disclosing an individual company's data — it does not mean zero. Country rows do not always sum to the world total because the source rounds each figure independently and does not always break out an “other countries” line.
Who holds the reserves
Zirconium reserves(thousand metric tons, ZrO2 content)
Zirconium reserves(thousand metric tons, ZrO2 content)thousand metric tons 2025
USGS Mineral Commodity Summaries 2026 · source ↗
| Country | Reserves | Share of world |
|---|---|---|
| Australia | 55,000 | 78.6% |
| South Africa | 5,900 | 8.4% |
| Other countries | 5,700 | 8.1% |
| Indonesia | 3,400 | 4.9% |
| Senegal | 2,600 | 3.7% |
| Madagascar | 2,100 | 3.0% |
| Mozambique | 1,500 | 2.1% |
| United States | 500.0 | 0.7% |
| China | 500.0 | 0.7% |
| Sierra Leone | 290.0 | 0.4% |
| World total | >70,000 | 100% |
The source publishes this world total as a bound rather than a point figure, so the shares in the last column are themselves bounds.
Price
Price: Zircon, dollars per metric ton (gross weight): Premium grade, cost, insurance, and freight, China
Annual averagedollars per metric ton
Basis: Price: Zircon, dollars per metric ton (gross weight): Premium grade, cost, insurance, and freight, China. Annual averages as published in USGS Mineral Commodity Summaries 2026 · source ↗. These are reference annual averages, not a live market quote.
Price: Zircon, dollars per metric ton (gross weight): Imported
Annual averagedollars per metric ton
Basis: Price: Zircon, dollars per metric ton (gross weight): Imported. Annual averages as published in USGS Mineral Commodity Summaries 2026 · source ↗. These are reference annual averages, not a live market quote.
Price: Zirconium, sponge, ex-works China, dollars per kilogram
Annual averagedollars per kilogram
Basis: Price: Zirconium, sponge, ex-works China, dollars per kilogram. Annual averages as published in USGS Mineral Commodity Summaries 2026 · source ↗. These are reference annual averages, not a live market quote.
What it is used for
All end markets →| End market | What it does there | Importance |
|---|---|---|
| Nuclear Power | Fuel-rod cladding | Defining |
How much of it a technology needs
| Technology | Quantity | Quoted | Basis |
|---|---|---|---|
| Pressurised Water Reactor | 20.00–40.00 t | per GW of capacity | Cladding tubes and structural grids |
Indicative range compiled from published technology studies and chemistry; verify against a manufacturer specification before use. Run these numbers at any scale in the material calculator →
Follow it across the borders
All journeys →Where a consignment of this material actually goes — every country, every custodian, and what is left behind at each step.
Kazakh uranium to a fuel assembly in a reactor The most tightly watched journey covered here: every kilogram is accounted for, at every border.