Oceania
Australia
本地开采的矿产、尚未开采的储量,以及相关资产的运营方。
其产出
地图 →USGS Mineral Commodity Summaries 2026 · 2025 (估计值) · 每行保留来源对该商品所用的单位 · 来源 ↗
横向滚动表格以查看其余列。
| 材料 | 系列 | 产量 | 单位 | 占全球份额 |
|---|---|---|---|---|
| Garnet (Industrial) | Mine production | 350,000 | metric tons | 47.9% |
| Bauxite | Bauxite, mine production | 97,000 | thousand metric dry tons | 22.0% |
| Lithium | Mine production | 92,000 | metric tons | 31.7% |
| Nickel | Mine production | 45,000 | metric tons | 1.2% |
| Rare Earths (all) | Mine production | 29,000 | metric tons | 7.4% |
| Alumina | Alumina, refinery production | 17,000 | thousand metric dry tons | 11.3% |
| Tin | Mine production | 12,000 | metric tons | 4.1% |
| Salt | Mine production | 12,000 | thousand metric tons | 4.4% |
| Industrial Sand & Gravel | Mine production | 5,600 | thousand metric tons | 1.3% |
| Gypsum | Mine production | 4,200 | thousand metric tons | 2.6% |
| Cobalt | Mine production | 3,700 | metric tons | 1.2% |
| Phosphate Rock | Mine production | 2,500 | thousand metric tons | 1.0% |
| Lime | Production | 1,900 | thousand metric tons | 0.5% |
| Manganese | Mine production | 1,600 | thousand metric tons | 8.0% |
| Aluminium | Smelter production | 1,500 | thousand metric tons | 2.0% |
| Nitrogen (Ammonia) | Plant production | 1,500 | thousand metric tons | 0.9% |
| Antimony | Mine production | 1,300 | metric tons | 1.2% |
| Zinc | Mine production | 1,100 | thousand metric tons | 8.5% |
| Silver | Mine production | 1,000 | metric tons | 3.8% |
| Molybdenum | Mine production | 1,000 | metric tons | 0.4% |
| Tungsten | Mine production | 1,000 | metric tons | 1.2% |
| Sulfur | Production, all forms | 900.0 | thousand metric tons | 1.1% |
| Copper | Mine production | 730.0 | thousand metric tons | 3.2% |
| Cadmium | Refinery production | 600.0 | metric tons | 2.6% |
| Lead | Mine production | 480.0 | thousand metric tons | 10.7% |
| Zirconium | Zirconium mineral concentrates, mine production (thousand metric tons, gross weight) | 400.0 | thousand metric tons | 33.3% |
| Magnesium Compounds | Mine production | 400.0 | thousand metric tons | 1.9% |
| Gold | Mine production | 280.0 | metric tons | 8.5% |
| Tantalum | Mine production | 50.00 | metric tons | 2.0% |
| Titanium | Titanium sponge metal production | Zero | metric tons | — |
| Silicon | Ferrosilicon | Zero | thousand metric tons | — |
| Vanadium | Mine production | Zero | metric tons | — |
其储备内容
USGS Mineral Commodity Summaries 2026 · 最新公布储量
| 材料 | 系列 | 储量 | 单位 | 占全球份额 |
|---|---|---|---|---|
| Nickel | Reserves | 25,000,000 | metric tons | 17.9% |
| Lithium | Reserves | 8,400,000 | metric tons | 22.7% |
| Rare Earths (all) | Reserves | 6,300,000 | metric tons | 7.4% |
| Bauxite | Bauxite reserves | 3,700,000 | thousand metric dry tons | 12.8% |
| Cobalt | Reserves | 1,700,000 | metric tons | 14.2% |
| Phosphate Rock | Reserves | 800,000 | thousand metric tons | 1.1% |
| Manganese | Reserves | 580,000 | thousand metric tons | 34.1% |
| Tin | Reserves | 570,000 | metric tons | 9.5% |
| Tungsten | Reserves | 570,000 | metric tons | 12.1% |
| Magnesium Compounds | Reserves | 280,000 | thousand metric tons | 3.6% |
| Tantalum | Reserves | 120,000 | metric tons | — |
| Antimony | Reserves | 110,000 | metric tons | 5.5% |
| Copper | Reserves | 100,000 | thousand metric tons | 10.2% |
| Silver | Reserves | 91,000 | metric tons | 14.9% |
| Zinc | Reserves | 64,000 | thousand metric tons | 26.7% |
| Zirconium | Zirconium reserves(thousand metric tons, ZrO2 content) | 55,000 | thousand metric tons | 78.6% |
| Lead | Reserves | 34,000 | thousand metric tons | 35.8% |
| Gold | Reserves | 13,000 | metric tons | 19.7% |
| Vanadium | Reserves | 10,000 | metric tons | 47.6% |
| Molybdenum | Reserves (thousand metric tons) | 760.0 | thousand metric tons | 4.5% |
| Gypsum | Reserves | Not applicable | thousand metric tons | — |
| Garnet (Industrial) | Reserves | Moderate to large | metric tons | — |
数据库中的矿山
全部 →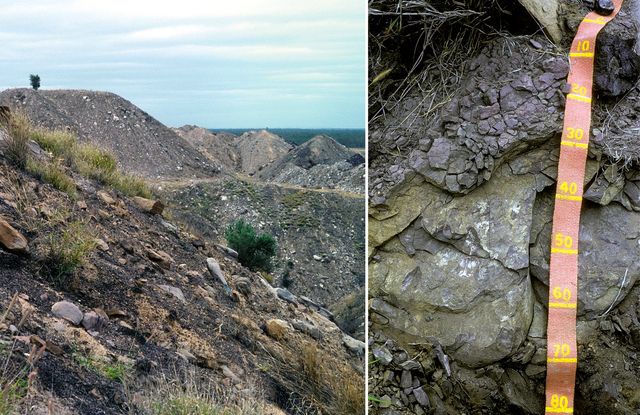
Bowen Basin
The largest seaborne source of hard coking coal.
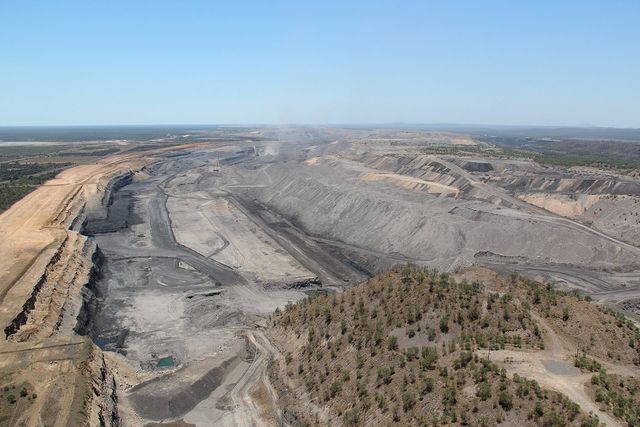
Cannington
One of the largest single silver producers in the world.
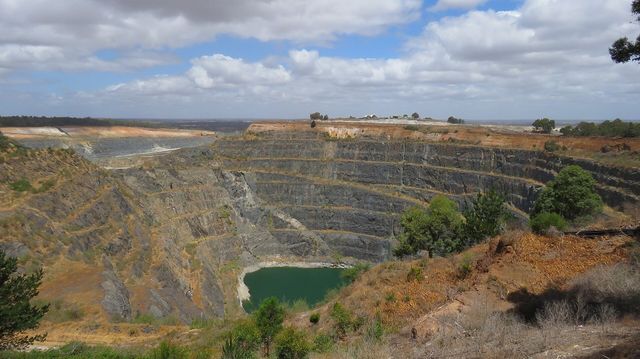
Greenbushes
The largest hard-rock lithium mine in the world.
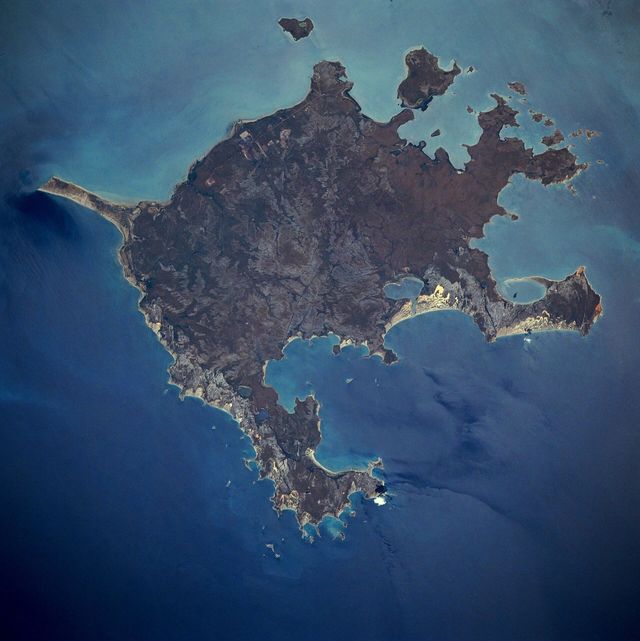
Groote Eylandt (GEMCO)
One of the largest and highest-grade manganese operations in the world.
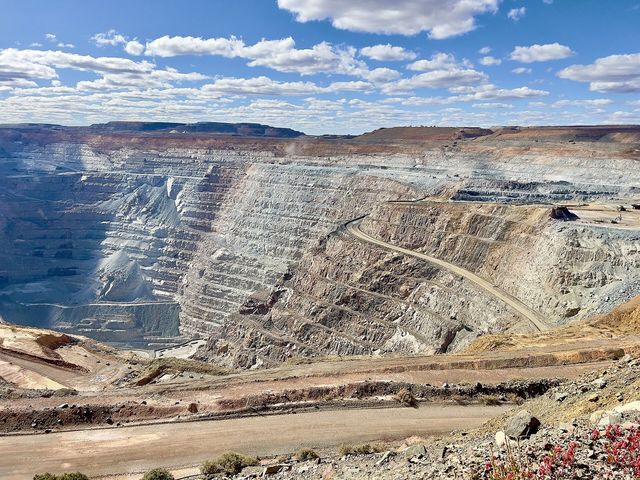
Kalgoorlie Super Pit (Fimiston)
One of the largest open-pit gold mines in the world.
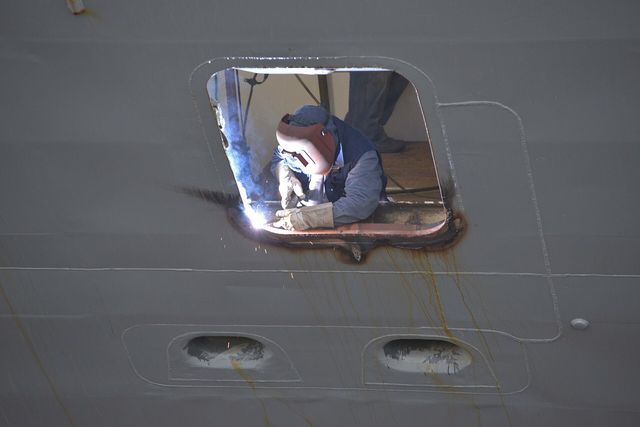
Mount Weld
The mine behind the largest rare-earth separation capacity outside China.
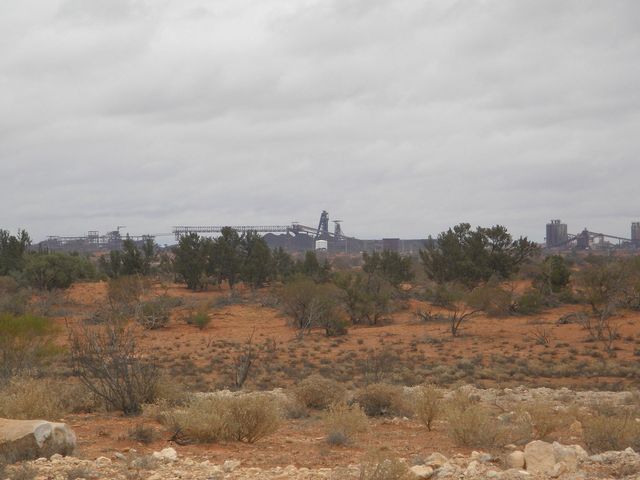
Olympic Dam
One of the largest single orebodies of any kind, holding copper, uranium, gold and silver together.
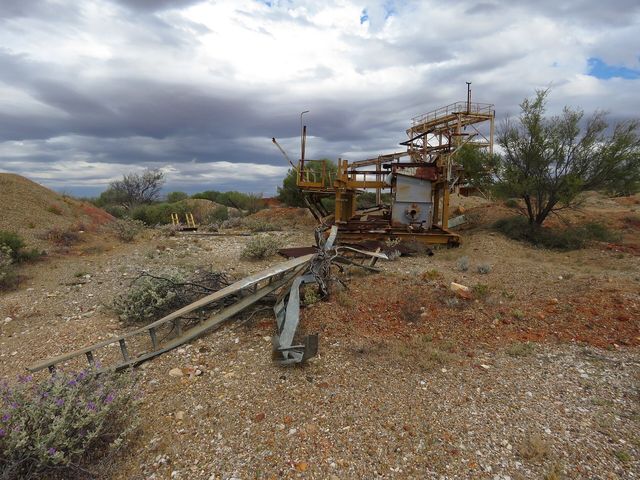
Pilbara Iron Ore District
The largest iron-ore export region in the world.
Pilgangoora
One of the largest independent hard-rock lithium operations.
途经此地的溯源记录 Australia
全部溯源记录 →在此开采、在此精炼,或仅过境前往他处的材料。
Australian rare earths to a magnet in a motor 起始于此 Mined in Australia, cracked in Malaysia, magnetised in China, and fitted in Germany. Australian spodumene to a battery, the fast way 起始于此 Eight weeks instead of eighteen months, at the cost of a great deal more energy. Pilbara iron ore to Chinese steel 起始于此 The largest material flow on Earth: dig it, crush it, screen it, and put it on a boat.美国的主要进口来源之一,供应商品:
USGS Mineral Commodity Summaries 2026 · 美国主要进口来源,2021–2024年