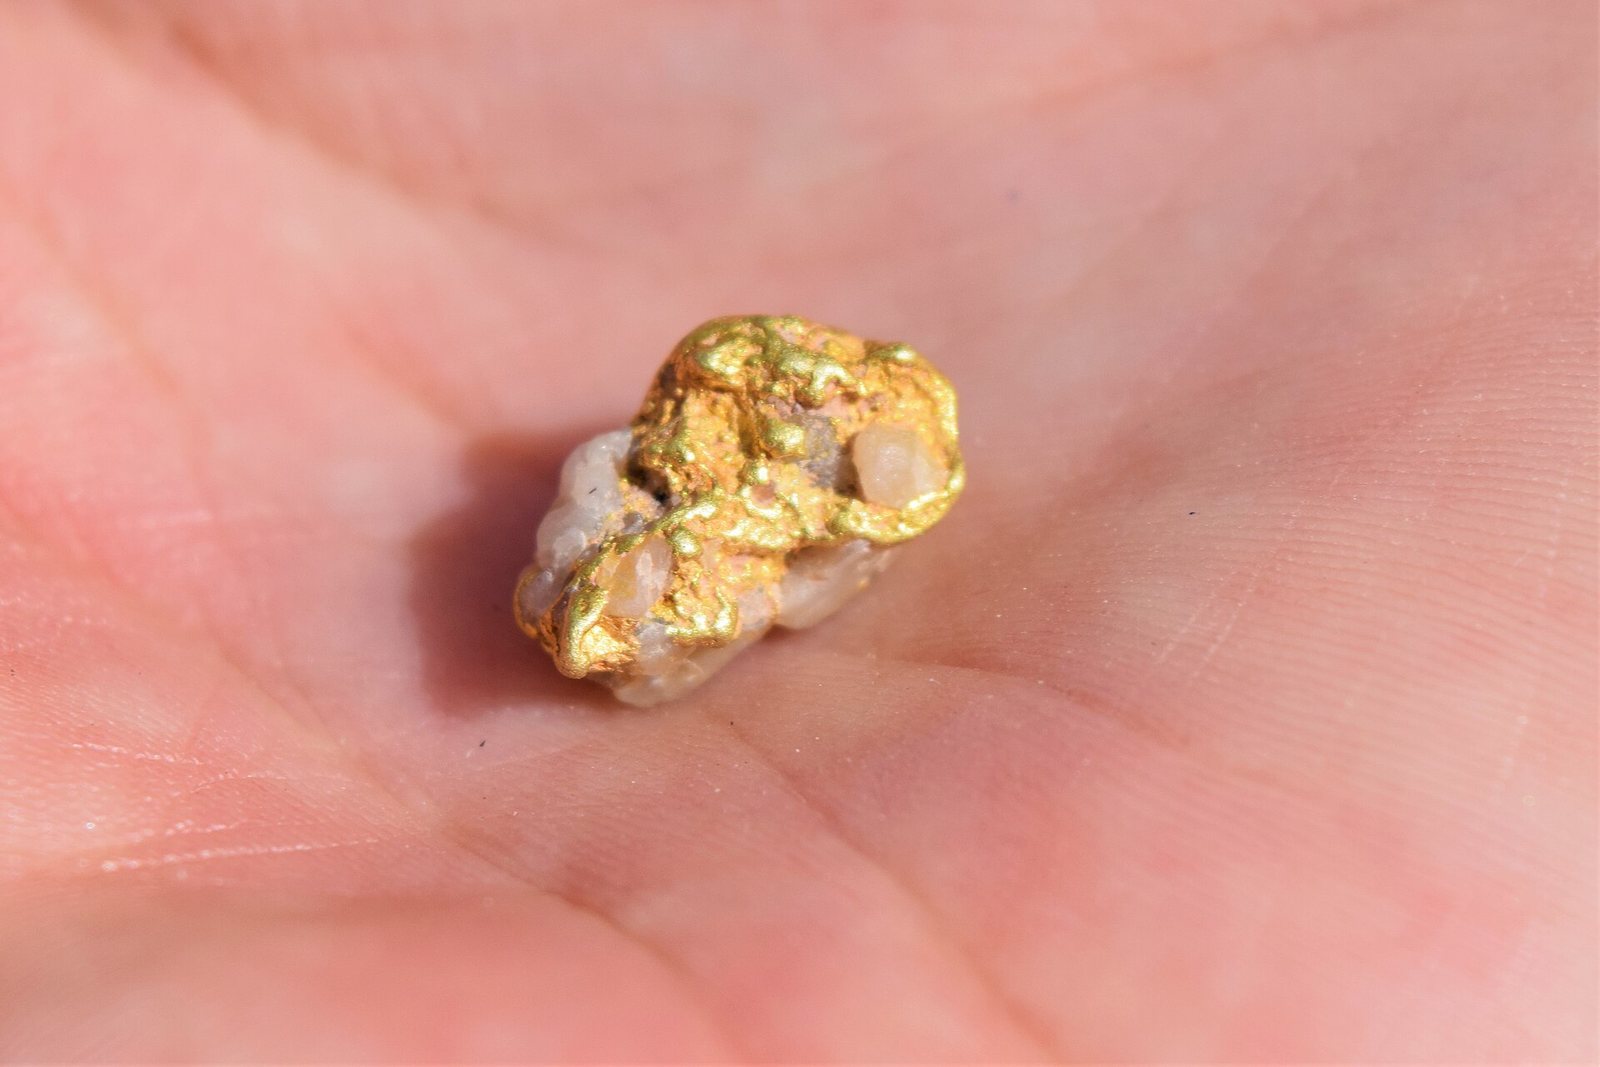
Bu nedir?
The metal that does not tarnish, does not corrode and never runs out once mined — which is why almost all of it ever produced still exists.
Neden önemli?
Gold is a monetary asset first and an industrial one second, but its bonding wires and plated contacts sit inside most electronics.
Where it is in the Earth
Where it is in the Earth
Gold is one of the least reactive elements in the periodic table, which is both the reason it has been prized for millennia and the reason it tends to occur in the Earth's crust as native metal — the pure element itself, rather than locked inside a compound the way iron or aluminium are. In most of the crust, gold is present only in vanishingly small concentrations, dispersed atom by atom through common rock. A deposit worth mining exists only where some geological process has gathered those atoms into a much smaller volume, raising the concentration by orders of magnitude above the background level.
The most important of those processes is hydrothermal circulation: hot, chemically active water moving through fractures in the crust, dissolving gold from a large volume of surrounding rock and then depositing it when the fluid cools or meets rock of a different chemistry. This mechanism produces what geologists call orogenic gold deposits — bodies of quartz veins carrying native gold, formed deep in ancient mountain belts during episodes of continental collision. The Archaean-age greenstone belts of Western Australia, Canada and West Africa are classic settings; they are old, geologically stable terrains where billions of years of erosion have exposed the roots of ancient mountain systems. The Kalgoorlie district of Australia is perhaps the best-known example.
A second major family of deposits forms where large bodies of magma, particularly those associated with subduction zones where one tectonic plate descends beneath another, interact with surrounding rock. These porphyry systems, named for the texture of the igneous rock at their centre, are primarily copper deposits, but gold is almost always present alongside the copper, sometimes in commercially significant quantities. The Grasberg mine in Indonesia and the Bingham Canyon mine in Utah are both porphyry systems. A related type, the iron-oxide copper-gold deposit, exemplified by Olympic Dam in South Australia, concentrates gold along with copper, uranium and silver in a different geological setting but by broadly similar hydrothermal mechanisms. South Africa's Witwatersrand basin is geologically distinct from all of these: an ancient sedimentary basin where gold-bearing gravels were deposited by rivers roughly two and a half billion years ago and then buried, compressed and partially re-mobilised, forming the conglomerate reefs that made South Africa the world's dominant producer for most of the twentieth century.
Getting it out
Getting it out
The method used to mine a gold deposit depends almost entirely on how deep the ore sits, how large the orebody is, and what grade it carries. Grade — the concentration of gold in the rock — is expressed in grams per tonne (g/t), and the ore-mineral table shows that workable deposits range from roughly 0.5 g/t at the low end to around 10 g/t at the high end. To put that in physical terms, even a high-grade ore at 10 g/t contains ten grams of gold in every tonne of rock — roughly the weight of two UK five-pence coins in a tonne of material. At 0.5 g/t, the ratio is fifty times more dilute. The consequence is that gold mining moves an enormous quantity of waste rock and lower-grade material for every unit of metal recovered.
Shallow, large, lower-grade deposits are typically mined by open-pit methods: a progressively deepening excavation worked in benches, with trucks hauling broken rock to the surface. The Kalgoorlie Super Pit in Western Australia is a well-known example of this approach applied to an orogenic gold deposit. Where the ore is deep, or where the surface footprint needs to be constrained, underground mining is used instead. Mponeng in South Africa, which follows the narrow Witwatersrand reef far underground, is among the deepest mines of any kind in the world. Some large, low-grade orebodies at depth are amenable to block caving, a method in which the rock is undercut so that it collapses under its own weight into a series of collection points below — Grasberg and Oyu Tolgoi both use variants of this technique for their underground phases.
Gold is also recovered in substantial quantities as a by-product of mining done primarily for copper. When a porphyry copper deposit is processed, the gold present in the ore reports alongside the copper through the concentrator and smelter, and is eventually separated at a refinery. This means that a significant share of world gold production is not the primary purpose of the mines that produce it; it is incidental to copper mining, and its volume depends on decisions made with copper economics in mind rather than gold economics.
What pulls on it
What pulls on it
Gold occupies an unusual position among traded materials because the largest portion of demand in any given year is not driven by the need to make something. Central banks hold gold as a reserve asset; investors hold it through exchange-traded funds, futures contracts and physical bars; individuals in many cultures buy it as jewellery that functions simultaneously as ornament and store of value. These monetary and quasi-monetary flows dwarf industrial consumption in volume, and they respond to different signals — interest rates, currency confidence, geopolitical anxiety — rather than to manufacturing output or technology cycles. The price history shown elsewhere on this page, which moved from around the same level in 2021 and 2022 to substantially higher values by 2024 and 2025, reflects those monetary dynamics more than any shift in industrial use.
Industrial demand, while smaller in aggregate, is real and in some segments structurally growing. Gold's conductivity, resistance to tarnish, and ability to be drawn into extremely fine wire or deposited in very thin layers make it the preferred material for wire bonding in semiconductor packaging — the tiny wires that connect a silicon chip to its leadframe — and for the plating of electrical contacts where long-term reliability matters more than material cost. The end markets listed for this material include semiconductors, consumer electronics, and data centres and artificial intelligence infrastructure, all of which share the same underlying need: a connection that will not corrode or develop resistance over years of service. Growth in chip production and in the density of electronics generally puts upward pressure on this segment of demand, even as engineers work to use less gold per device.
Jewellery demand is large but sensitive to price; when gold is expensive, consumers in price-sensitive markets — particularly India and China, which together account for a large share of global jewellery fabrication — tend to buy lighter pieces or defer purchases. Dentistry, once a meaningful use, has declined steadily as ceramic and composite alternatives have improved. The industrial uses show no sign of a comparable decline; if anything, the expansion of advanced packaging techniques in semiconductors keeps this segment supported.
Turning ore into product Seviye 3
Turning ore into product
Gold processing begins with comminution — the staged crushing and grinding of ore to liberate gold particles from the surrounding rock. The energy cost of grinding is one of the largest operating expenses at any gold operation, and the fineness to which the ore must be ground depends on how finely the gold is intergrown with the host minerals. Once the rock is reduced to a fine slurry, the dominant extraction route for most deposits is cyanide leaching: a dilute sodium cyanide solution dissolves native gold selectively, forming a soluble gold-cyanide complex that can be separated from the remaining solids. The loaded solution is then passed over activated carbon, which adsorbs the gold complex, and the gold is subsequently stripped from the carbon, electroplated from solution, and smelted into a crude alloy called doré. Doré is typically a mixture of gold and silver with minor impurities, and it is the traded form that leaves the mine. Further refining at specialist facilities — the data show that Atlantic Copper's Huelva smelter and the Guixi smelter in China are among the plants in this chain — removes the silver and other elements to bring the gold to the high purities required by the London Bullion Market Association's good-delivery standard, which specifies bars of 350 to 430 troy ounces.
Recovery rates — the fraction of gold in the feed that ends up in the final product — vary considerably with ore type. Free-milling ores, where the gold occurs as discrete, liberated particles, typically achieve high recoveries through straightforward cyanidation. Refractory ores are more problematic: in these, the gold is physically locked inside sulfide minerals such as pyrite or arsenopyrite, and the cyanide solution cannot reach it without pre-treatment. Pre-treatment options include pressure oxidation (autoclaving the sulfide concentrate under high temperature and pressure to break down the sulfide matrix), bio-oxidation (using bacteria to oxidise the sulfides), and roasting. Each adds capital and operating cost and introduces additional points where gold can be lost. The by-product complexity of porphyry processing is also worth noting: copper concentrates from these mines carry gold into the smelter, where it reports to the anode slimes during copper electro-refining and must be recovered in a separate precious-metals circuit. The accounting for gold produced this way is straightforward in principle but depends on smelter terms and the efficiency of the slimes treatment step.
Substitution and recycling Seviye 3
Substitution and recycling
In monetary and jewellery uses, substitution is essentially a matter of preference and convention rather than technical equivalence; no other metal carries the same cultural weight or the same millennia-long track record as a store of value. In industrial applications the picture is more tractable but still constrained. Copper wire bonding has been adopted widely as a lower-cost alternative to gold in semiconductor packaging, and silver is used in some contact applications. Copper bonds adequately in many standard chip packages, but it is harder than gold, more prone to oxidation during bonding, and requires tighter process control; for the most demanding applications — fine-pitch bonds, harsh operating environments, high-reliability requirements — gold remains preferred. Palladium-coated copper wire occupies an intermediate position. The general direction of the industry has been to substitute where the application allows it and to retain gold where the risk of substitution-related failure is judged too high.
Recycling is both extensive and, in principle, efficient. Because gold does not corrode and retains its value regardless of what form it takes, the economic incentive to recover it from end-of-life material is strong. Scrap from jewellery fabrication and from end-of-life jewellery returns to the refining system at high rates. Electronic scrap — printed circuit boards, connector strips, bonding wire — also carries recoverable gold, though at much lower concentrations than jewellery or doré. Urban mining of electronics is a real activity, and specialist refiners process large volumes of this material. The constraint is not economic incentive but collection logistics: a tonne of circuit boards must be collected, sorted and transported before any chemistry begins, and in many parts of the world the collection infrastructure is informal or absent. The recycled supply of gold is genuinely large relative to mine production — the data block notes that central-bank holdings and recycled scrap are tracked separately and are both substantial — but the proportion of contained gold that is actually recovered from small electronics at end of life remains well below what is theoretically possible.
Where the chain is fragile Seviye 4
Where the chain is fragile
Gold's supply geography looks reasonably diversified at first reading: the production table shows output spread across China, Russia, Australia, Canada, the United States, Ghana, Mexico, the Central Asian republics, Peru, South Africa and Indonesia, with no single country holding a dominant share of the 3,300 metric tonnes produced in 2025. The reserves picture is similarly spread, with Australia and Russia together accounting for a large but not overwhelming share of the 66,000 metric tonnes in reported world reserves. This apparent diversification, however, requires several qualifications. Reserves figures, as compiled by the USGS and other national survey bodies, reflect quantities that are economic to extract at current prices using current technology and with current permitting assumptions. They are not fixed physical inventories; they expand and contract as price, technology and regulation shift. The divergence between a country's share of current production and its share of stated reserves — South Africa produces 90 metric tonnes annually against 5,000 metric tonnes of reserves, for instance — reflects the economics and difficulty of mining those reserves, not merely their existence.
A structural fragility that does not appear in the production table is the by-product relationship. A meaningful share of world gold output is recovered as a co-product or by-product of copper mining, meaning its production volume is partly a function of copper mine operating rates rather than of gold-specific investment decisions. When a large copper operation curtails output for reasons unrelated to gold — labour disputes, tailings failures, permitting suspensions, or a period of low copper prices — gold by-product output falls with it. The mines listed in the data include several major porphyry copper-gold operations: Escondida, Grasberg, Oyu Tolgoi and Bingham Canyon. Disruptions at any of these affect gold supply in ways that the gold market cannot directly control or easily anticipate.
The refining and smelting step introduces a further concentration that the mine-production data do not capture. Doré from mines worldwide flows to a relatively small number of LBMA-approved refiners; the Guixi smelter in China and the Atlantic Copper facility in Huelva represent two nodes in that network. Capacity at this stage is adequate under normal conditions, but the geographic concentration of large-scale precious-metals refining capacity — and the degree to which certain refining flows pass through Chinese facilities — means that regulatory or logistical disruptions at key nodes could delay the conversion of doré into tradeable good-delivery bars. Lead times for new refinery capacity are long, and the permitting environment for expanding processing facilities in many jurisdictions has become more demanding. For a metal whose supply is notionally well-distributed at the mine level, the chain narrows considerably by the time metal reaches the form in which it is actually traded.
Kayada nereden gelir
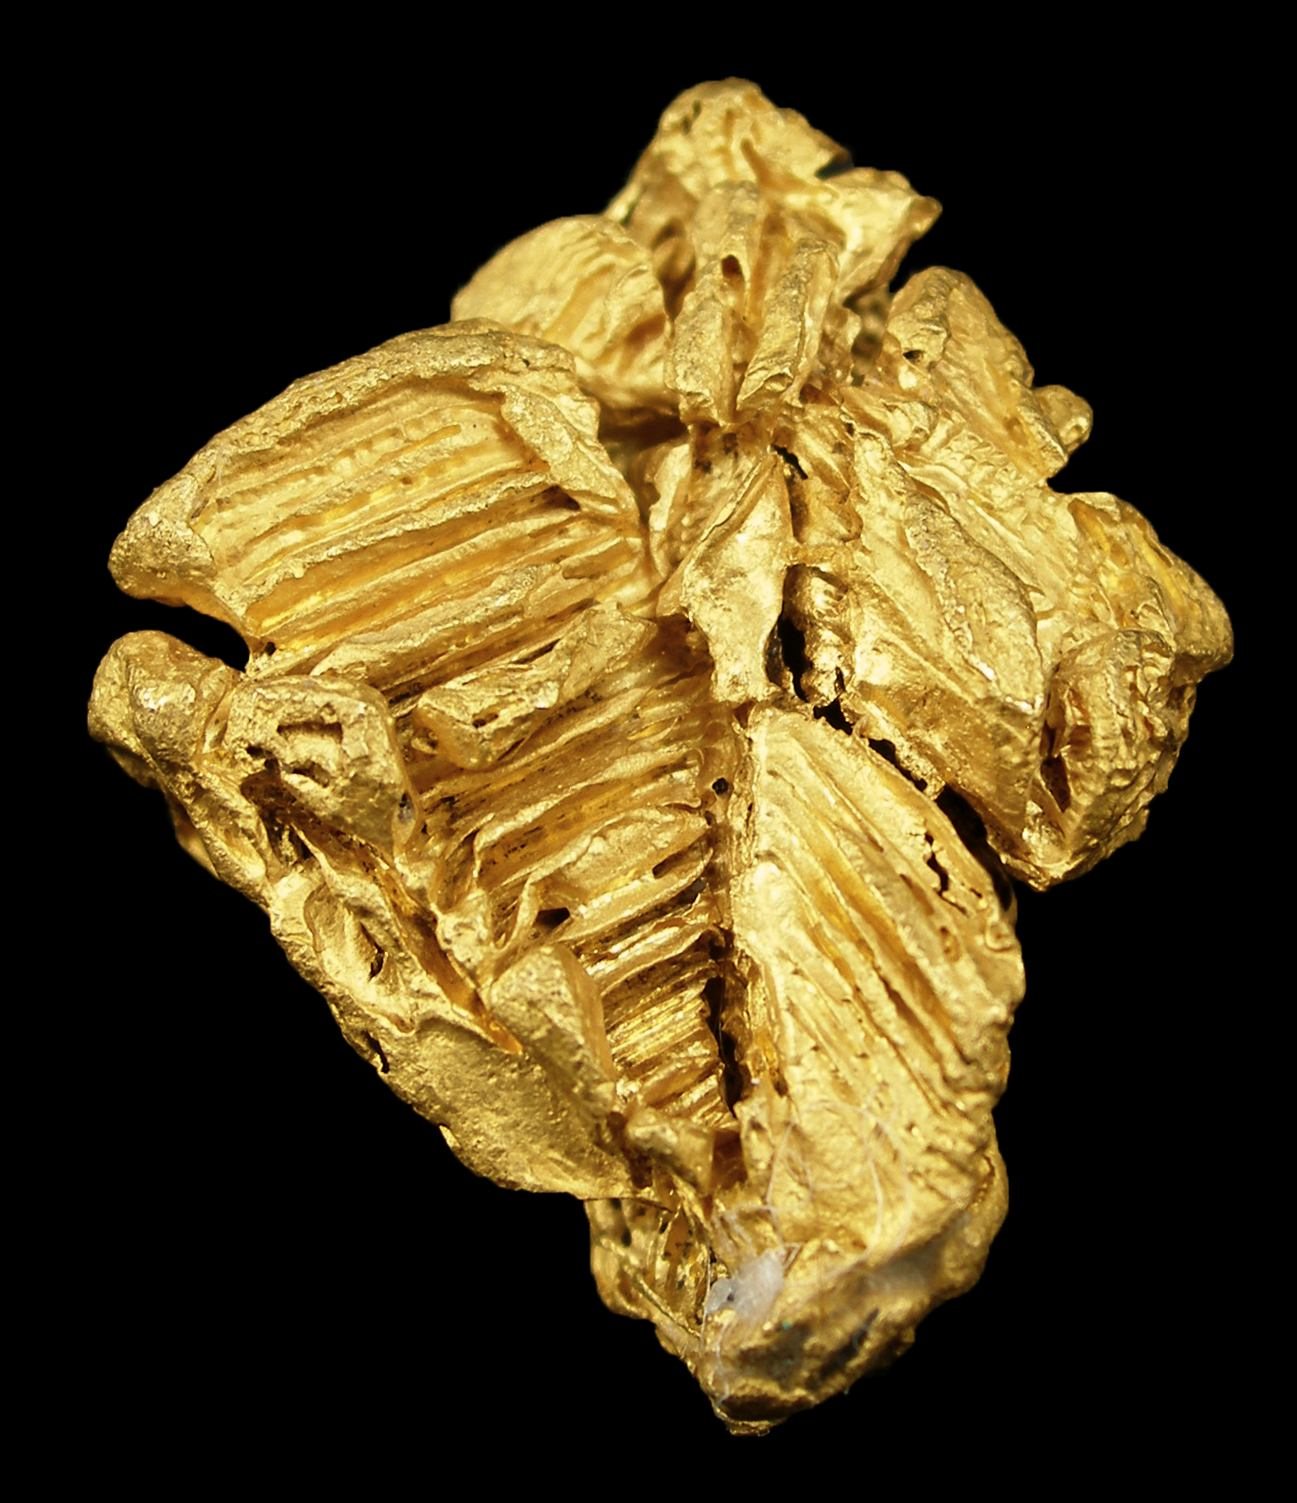
Tüm cevher mineralleri →Bunlar gerçekten taşıyan mineraller gold. Bir yatak, ancak içindeki minerallerden biri çıkarma maliyetini karşılayacak kadar yüksek tenörde olduğunda cevher kütlesi sayılır.
Kim üretiyor
Haritada gör →Mine production
Mine productionmetric tons 2025 (tahmini) Dünya toplamı 3,300 metric tons
USGS Mineral Commodity Summaries 2026 · Mine production of contained gold. Central-bank holdings and recycled scrap are separate and large. · kaynak ↗
Kalan sütunlar için tabloyu yatay kaydırın.
| Ülke | Üretim | Dünya payı |
|---|---|---|
| Other countries | 1,000 | 30.3% |
| China | 380.0 | 11.5% |
| Russia | 310.0 | 9.4% |
| Australia | 280.0 | 8.5% |
| Canada | 200.0 | 6.1% |
| United States | 160.0 | 4.8% |
| Ghana | 150.0 | 4.5% |
| Mexico | 140.0 | 4.2% |
| Kazakhstan | 130.0 | 3.9% |
| Uzbekistan | 130.0 | 3.9% |
| Peru | 110.0 | 3.3% |
| Indonesia | 90.00 | 2.7% |
| South Africa | 90.00 | 2.7% |
| Brazil | 80.00 | 2.4% |
| Dünya toplamı | 3,300 | 100% |
"Gizli tutulmuş", USGS'nin tek bir şirketin verisini ifşa etmekten kaçınmak amacıyla rakamı yayımlamadığı anlamına gelir; sıfır anlamına gelmez. Kaynak her rakamı bağımsız olarak yuvarladığı ve her zaman "diğer ülkeler" satırını ayrıştırmadığı için ülke satırları her zaman dünya toplamına eşit olmayabilir.
Rezervleri kim elinde bulunduruyor
Reserves
Reservesmetric tons 2025
USGS Mineral Commodity Summaries 2026 · kaynak ↗
| Ülke | Rezervler | Dünya payı |
|---|---|---|
| Australia | 13,000 | 19.7% |
| Russia | 12,000 | 18.2% |
| Other countries | 11,000 | 16.7% |
| South Africa | 5,000 | 7.6% |
| Indonesia | 3,600 | 5.5% |
| China | 3,200 | 4.8% |
| Canada | 3,200 | 4.8% |
| United States | 3,000 | 4.5% |
| Brazil | 2,500 | 3.8% |
| Kazakhstan | 2,300 | 3.5% |
| Peru | 2,200 | 3.3% |
| Uzbekistan | 2,200 | 3.3% |
| Mexico | 1,400 | 2.1% |
| Ghana | 1,000 | 1.5% |
| Dünya toplamı | 66,000 | 100% |
Fiyat
dollars per troy ounce
Yıllık ortalamadollars per troy ounce
Dayanak: dollars per troy ounce. Şurada yayımlanan yıllık ortalamalar: USGS Mineral Commodity Summaries 2026 · kaynak ↗. Bunlar referans yıllık ortalamalar olup canlı piyasa fiyatı değildir.
Bu materyali üreten madenler
Tüm madenler →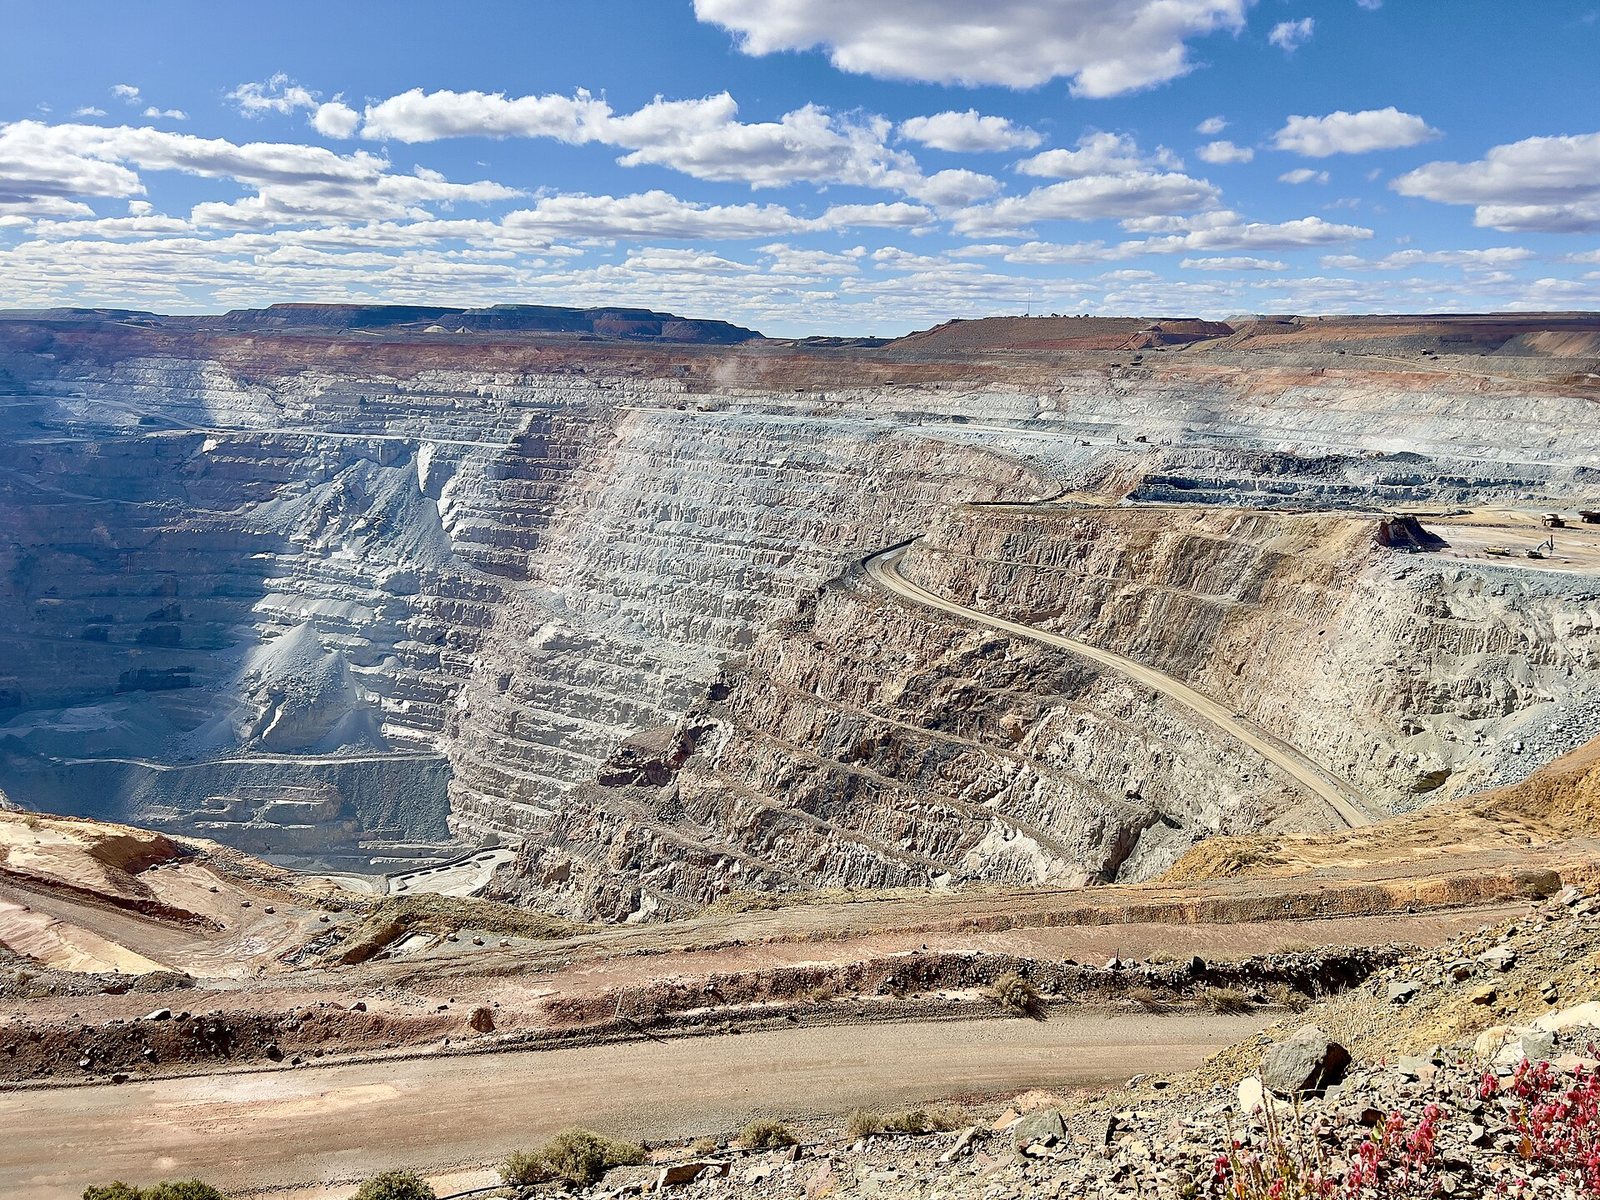
Kalgoorlie Super Pit (Fimiston) →
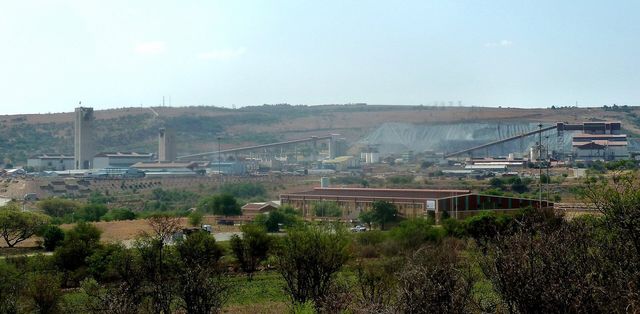
Mponeng
The deepest mine on Earth, working below 4 km.
Grasberg
One of the largest copper deposits and among the largest gold deposits ever mined.
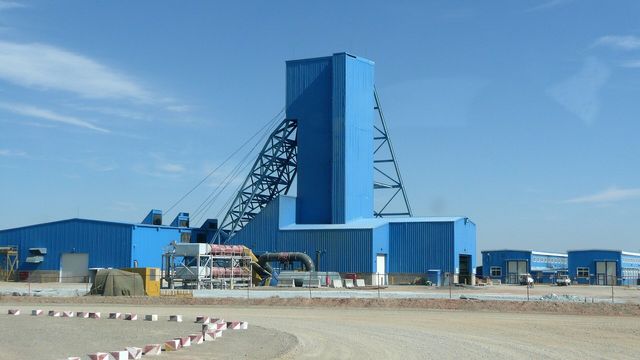
Oyu Tolgoi
Expected to become one of the largest copper mines in the world as the block cave ramps up.
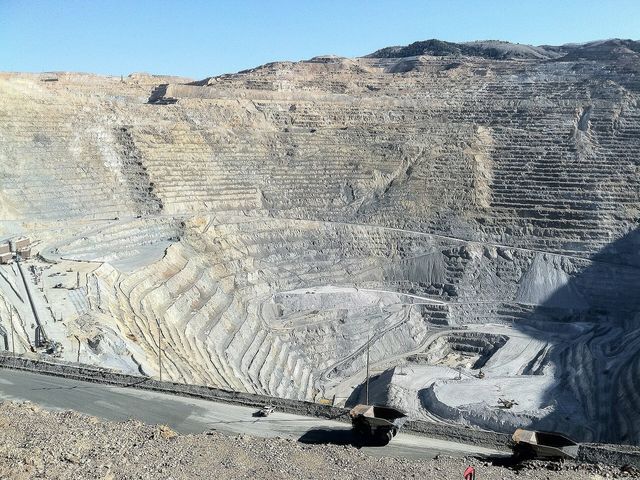
Bingham Canyon
The largest excavation made by people.
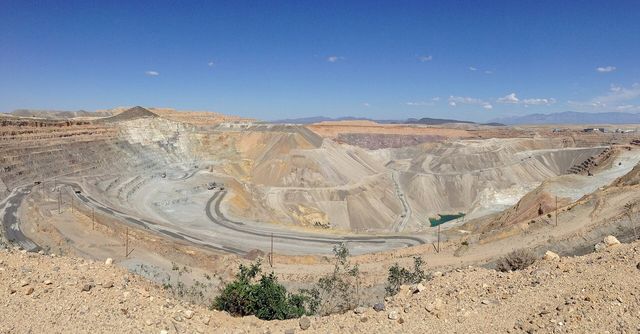
Carajás
The highest-grade large iron-ore operation in the world.
Escondida
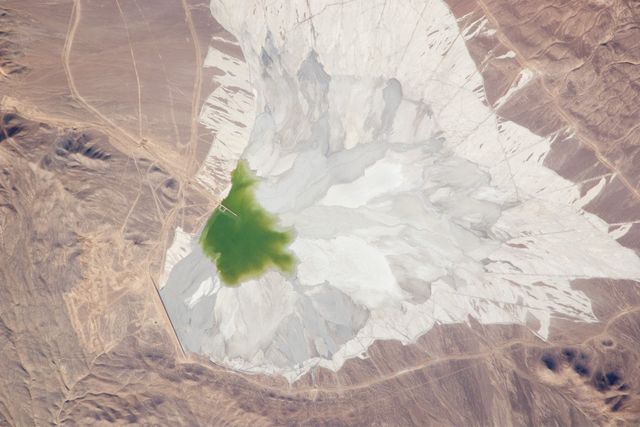
Consistently the largest copper mine in the world by output.
Olympic Dam
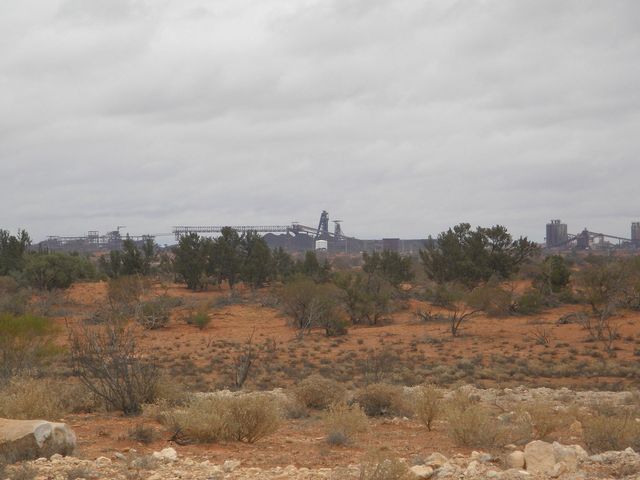
One of the largest single orebodies of any kind, holding copper, uranium, gold and silver together.
Nerede işlenir ve rafine edilir
| Tesis | Tür | Aşama | Ülke | Rol |
|---|---|---|---|---|
| Atlantic Copper Smelter, Huelva | İzabe tesisi | İşleme | Spain | Çıktı |
| Guixi Smelter | İzabe tesisi | İşleme | China | Çıktı |
Ne için kullanılır
Tüm son kullanım piyasaları →| Son pazar | Orada ne işe yarar | Önem |
|---|---|---|
| Semiconductors | Bonding and plating | Önemli |
| Consumer Electronics | Contacts and bonding | Önemli |
| Data Centres & AI | Bonding wires and connector plating | Günümüz |
İhracat kontrolleri
| Ülke | Kontrol | Uygulandığı kapsam |
|---|---|---|
| Laos | Export ban | Raw minerals, including copper, gold, iron, nickel, potassium, silver, and zinc (2024). ↗ |
| Tanzania | Export ban | Ore concentrates of copper, gold, nickel, and silver (2017). ↗ |
| Venezuela | Export ban | Bauxite, cassiterite, columbite-tantalite, copper, gold, rhodium, silver, and thorium (2024). ↗ |
USGS Mineral Commodity Summaries 2026, table 4 — controls in effect as of January 2026, excluding controls since lifted.