What is it?
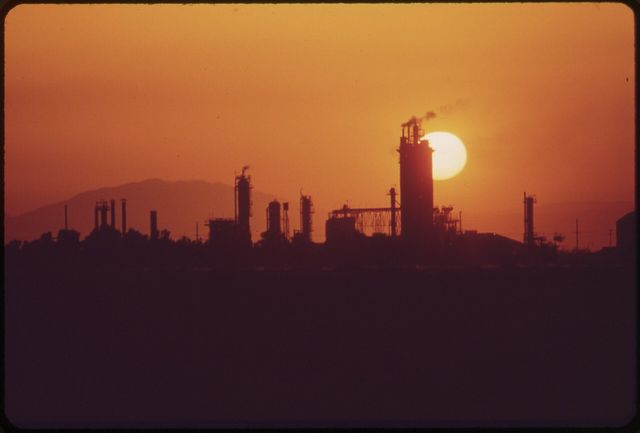
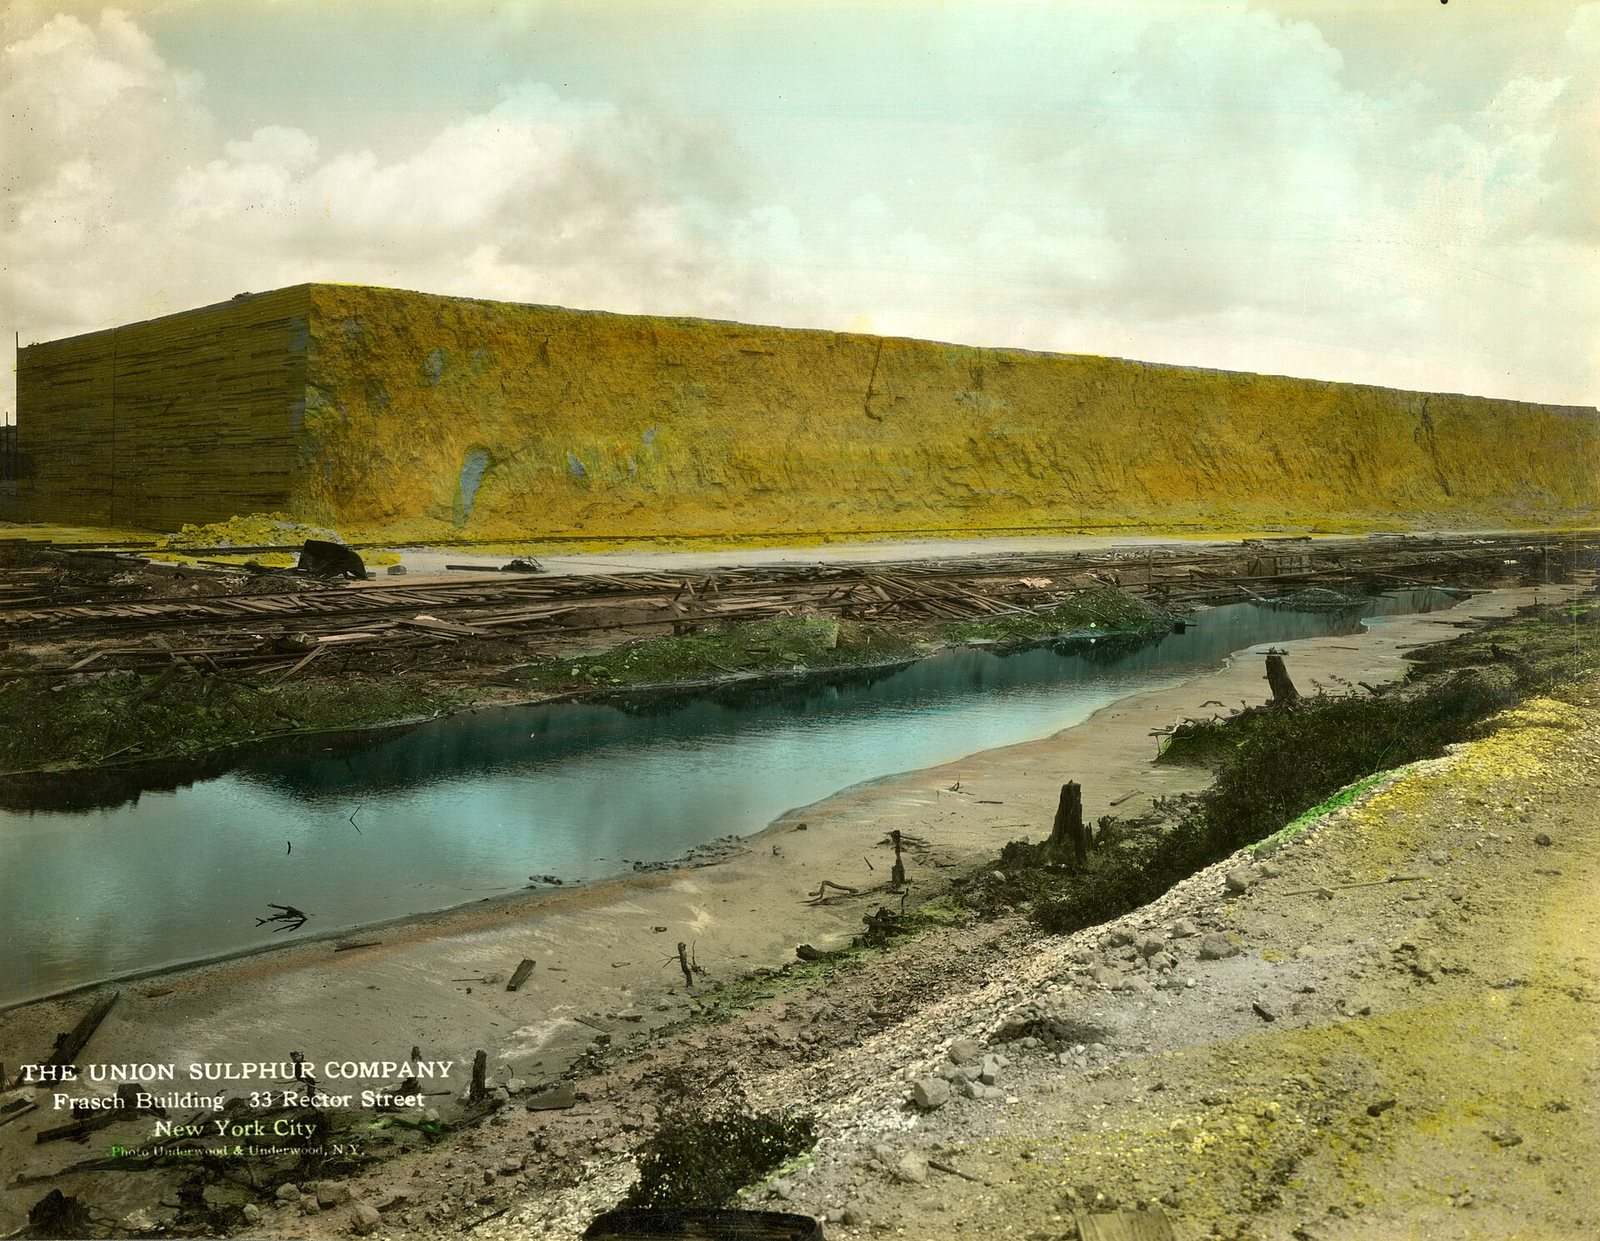
A yellow element stripped out of oil and gas to stop it polluting, then turned into sulfuric acid — the most-produced chemical in the world.
Why does it matter?
Sulfuric acid leaches copper, nickel and rare earths and makes phosphate fertiliser. Almost all of it comes from fossil-fuel processing, so decarbonisation shrinks its supply.
Deeper written sections for this material have not been published yet. Everything below is drawn straight from the source datasets and is complete.
Who produces it
See it on a map →Production, all forms
Production, all formsthousand metric tons 2025 (estimated) World total 84,000 thousand metric tons
USGS Mineral Commodity Summaries 2026 · All forms, gross weight; recovered (by-product) sulfur dominates. · source ↗
Scroll the table sideways for the remaining columns.
| Country | Production | Share of world |
|---|---|---|
| China | 19,000 | 22.6% |
| United States | 8,100 | 9.6% |
| Russia | 7,500 | 8.9% |
| Saudi Arabia | 7,200 | 8.6% |
| United Arab Emirates | 6,300 | 7.5% |
| Other countries | 5,700 | 6.8% |
| Canada | 5,000 | 6.0% |
| Kazakhstan | 4,800 | 5.7% |
| India | 3,700 | 4.4% |
| Qatar | 3,100 | 3.7% |
| Korea, Republic of | 3,100 | 3.7% |
| Japan | 2,700 | 3.2% |
| Iran | 2,100 | 2.5% |
| Chile | 1,400 | 1.7% |
| Kuwait | 1,300 | 1.5% |
| Poland | 1,100 | 1.3% |
| Australia | 900.0 | 1.1% |
| Turkmenistan | 870.0 | 1.0% |
| World total | 84,000 | 100% |
“Withheld” means the USGS suppressed the figure to avoid disclosing an individual company's data — it does not mean zero. Country rows do not always sum to the world total because the source rounds each figure independently and does not always break out an “other countries” line.
Price
average unit value, free on board, mine and (or) plant, dollars per metric ton of elemental sulfur
Annual averagedollars per metric ton
Basis: average unit value, free on board, mine and (or) plant, dollars per metric ton of elemental sulfur. Annual averages as published in USGS Mineral Commodity Summaries 2026 · source ↗. These are reference annual averages, not a live market quote.
Mines that produce it
All mines →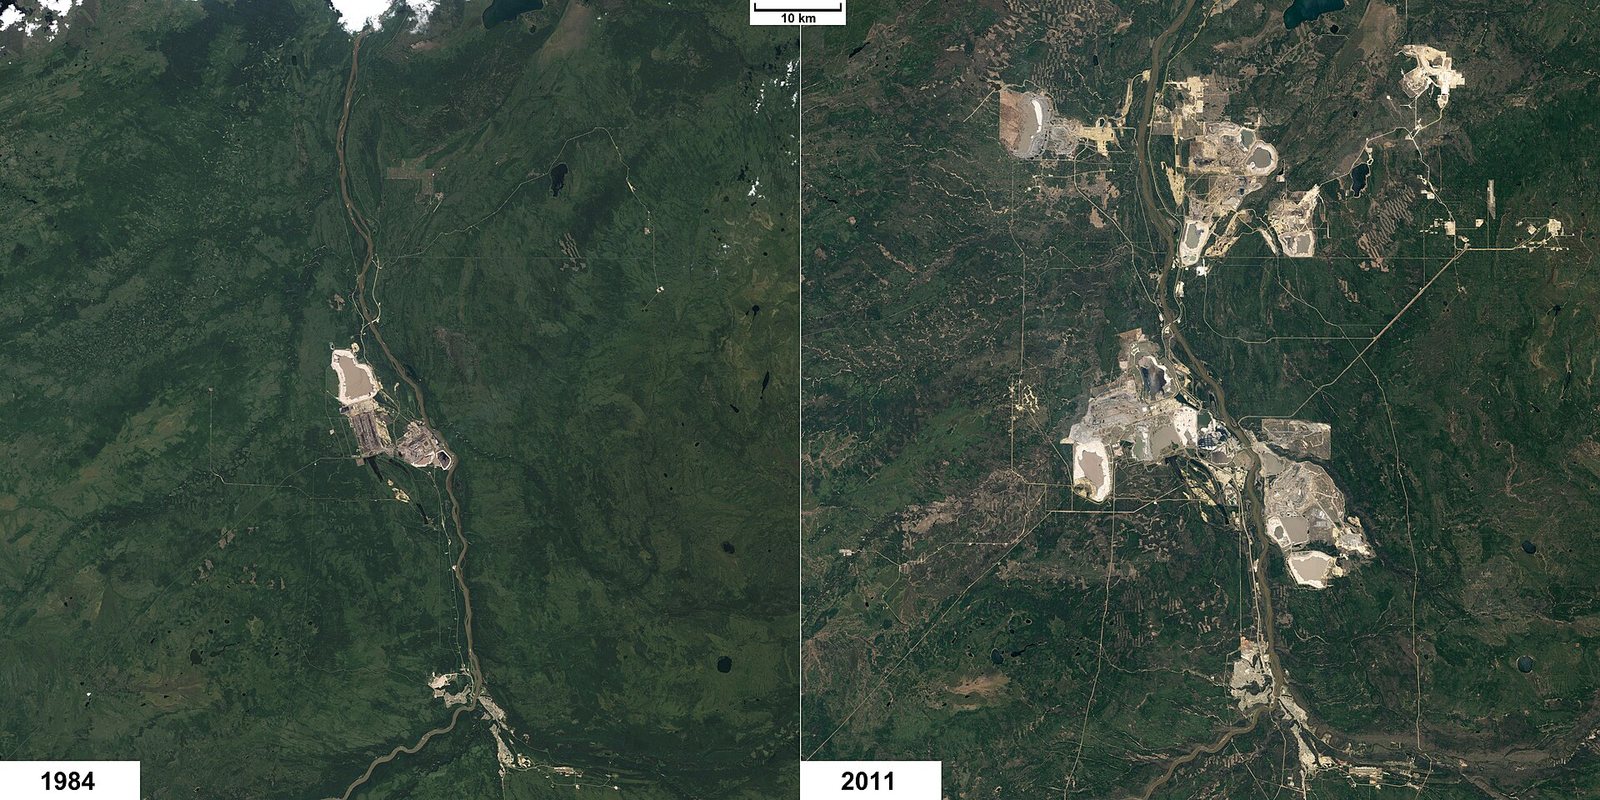
Athabasca Oil Sands (Mildred Lake / Aurora) →
Where it is processed and refined
| Plant | Kind | Stage | Country | Role |
|---|---|---|---|---|
| Atlantic Copper Smelter, Huelva | Smelter | Processing | Spain | Output |
What it is used for
All end markets →| End market | What it does there | Importance |
|---|---|---|
| Agriculture & Food | Sulfuric acid to make phosphate fertiliser | Defining |
How much of it a technology needs
| Technology | Quantity | Quoted | Basis |
|---|---|---|---|
| Vanadium Redox Flow Battery | 3.00–8.00 t | per MWh of storage | Sulfuric acid electrolyte |
Indicative range compiled from published technology studies and chemistry; verify against a manufacturer specification before use. Run these numbers at any scale in the material calculator →
Follow it across the borders
All journeys →Where a consignment of this material actually goes — every country, every custodian, and what is left behind at each step.
Australian spodumene to a battery, the fast way Eight weeks instead of eighteen months, at the cost of a great deal more energy. Chilean sulfide concentrate to Chinese cathode to a wire Chile mines the most copper in the world. China refines the most. Those are not the same sentence. Venezuelan extra-heavy crude to diesel, asphalt and aluminium anodes Oil so thick it will not flow down a pipe, and cannot be refined by most refineries on Earth.