Was ist das?
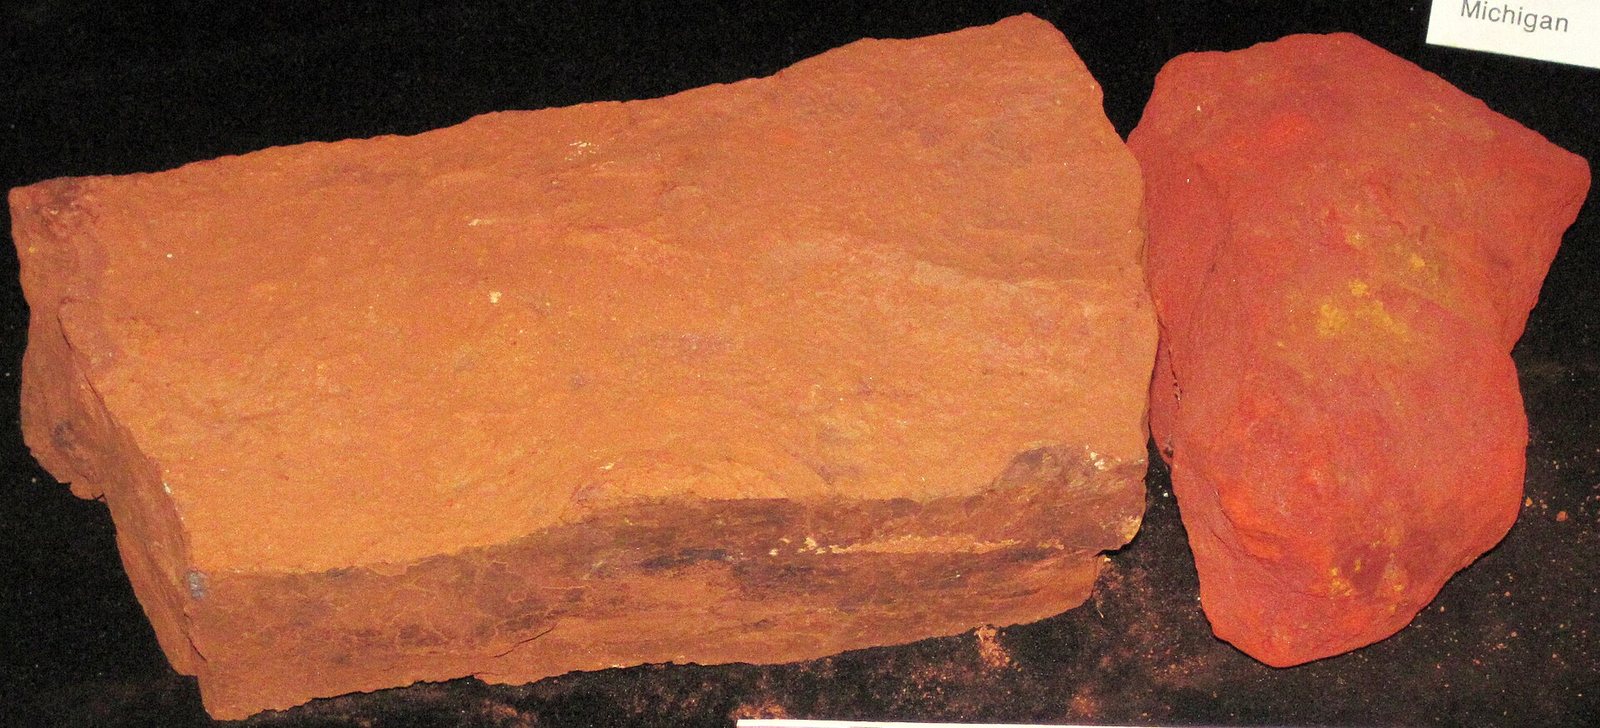
Rust-coloured rock that is roughly one-third to two-thirds iron, and the single largest tonnage the mining industry moves.
Warum ist das wichtig?
Steel is about ninety-five percent of all metal used by weight. Everything else on this site is, by tonnage, a rounding error next to iron.
Where it is in the Earth
Where it is in the Earth
Almost all of the iron ore mined today came into existence during a narrow window of geological time, roughly two to two and a half billion years ago, when Earth's oceans were still largely free of dissolved oxygen. Iron-bearing fluids, released by submarine volcanic activity, reacted with oxygen produced by early photosynthetic organisms. The iron oxidised and settled to the seafloor in thin, alternating layers of iron-rich minerals and chert — a fine-grained silica rock. Over geological time these sediments were buried, compacted and sometimes heated, producing the characteristic banded appearance that gives the rock its name: banded iron formation, or BIF. This rock type is the source of the overwhelming majority of the world's iron ore reserves and virtually all of the large-scale mining operations the tables on this page describe.
BIF on its own is not always economic to mine directly, because its iron content can be too dilute. What makes a deposit mineable is secondary enrichment — a later process in which groundwater, over tens of millions of years, dissolves away the silica and concentrates the iron minerals into a softer, higher-grade mass. The two minerals that result from this are hematite, an oxide with the formula Fe₂O₃, and magnetite, an oxide with the formula Fe₃O₄. Hematite-enriched BIF, where the iron content has risen to the point at which the ore can be loaded onto a ship without further treatment, is called direct-shipping ore. Australia's Pilbara region and Brazil's Carajás district are the world's pre-eminent examples of this type. Magnetite deposits, found across much of China and parts of Russia and other countries, tend to be lower in iron content as mined and require concentration at the mine site before they can be used.
The geography of reserves follows directly from the distribution of ancient BIF sequences. Australia holds the largest reported reserves in the tables, with Brazil and Russia close behind. These numbers reflect both the original extent of ancient seafloor sediments and the degree to which later enrichment has raised grades to economic levels. China appears in both the production and reserve tables, but its domestic ore tends to be lower-grade magnetite rather than the high-grade hematite that trades internationally, which is why China remains a very large importer despite substantial domestic output.
Getting it out
Getting it out
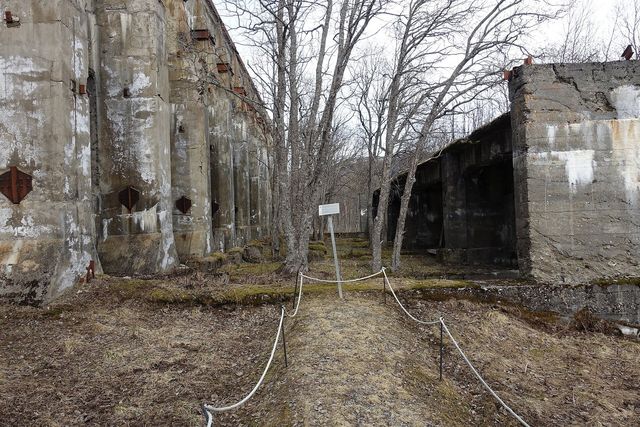
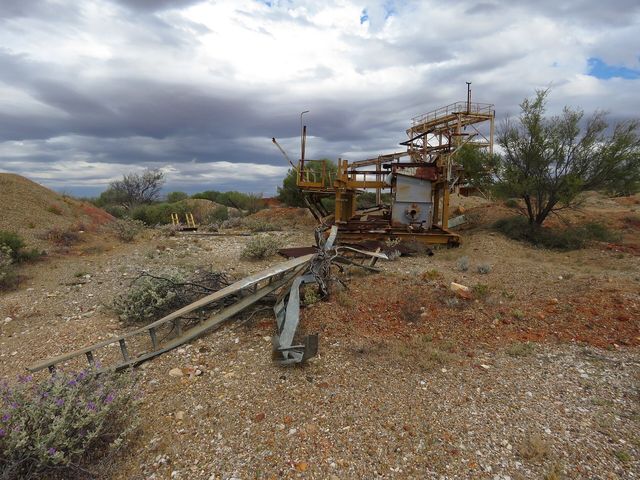
Iron ore is almost universally mined in open pits — large, stepped excavations that remove rock from the surface downward. The reason is straightforward: BIF-hosted deposits are often very large in areal extent but relatively shallow, making open-pit mining far cheaper than sinking shafts and developing underground workings. The ore is drilled, blasted, loaded into large trucks and driven to a crusher or, in the case of direct-shipping ore, to a screening and loading facility. The mines listed in the tables — the Pilbara district, Carajás, and Bayan Obo — are all open-pit operations, and they are among the largest volume-moving industrial operations on Earth.
Grade is the central economic fact of any ore deposit. In iron ore, grade is expressed as a percentage of iron by weight, written as Fe%. The benchmark that the traded market uses is 62% Fe — meaning 62 parts of iron in every 100 parts of ore. Direct-shipping hematite ore from the Pilbara and Carajás typically falls within or close to that range as it leaves the ground, which is why it can be shipped and sold with minimal processing. Magnetite ore, by contrast, is commonly mined at grades well below the traded benchmark. The gap between the mined grade and the saleable grade has to be closed by processing, which costs money and energy. The amount of material that must be moved to obtain a tonne of saleable product — including waste rock that contains no ore at all — varies enormously between deposits and is a primary driver of operating cost.
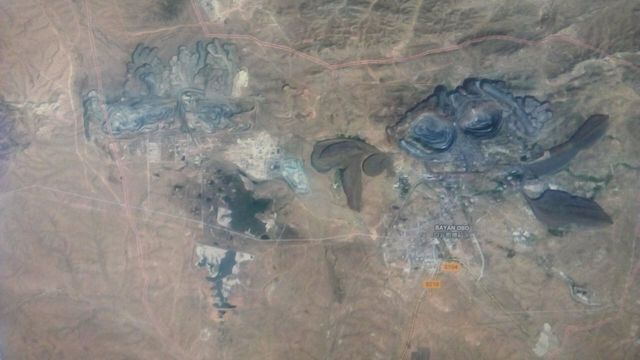
One exception to the open-pit pattern is Bayan Obo in Inner Mongolia, which is geologically unusual: it is hosted in a carbonatite, a rare igneous rock type, and carries iron alongside rare-earth elements and niobium. That makes it a polymetallic deposit where the economics of each commodity affect the others, and where the mining method and the processing flowsheet are more complicated than at a straightforward BIF hematite operation.
What pulls on it
What pulls on it
Iron ore is almost entirely a steel-making raw material. Steel production is the end market listed in the tables, and the connection is direct: iron ore is charged into a blast furnace with coke and limestone, the iron is reduced out of the oxide, and the resulting pig iron is refined into steel. There is no meaningful substitute for iron ore in this process, and steel is so deeply embedded in construction, transport, machinery and energy infrastructure that demand for iron ore broadly tracks global construction and manufacturing activity. When large economies are building rapidly — roads, bridges, buildings, railways — iron ore demand rises. When construction slows, it falls.
China is the central fact of the modern iron ore market. It accounts for roughly half of global steel production by most external estimates, and its reliance on seaborne iron ore from Australia and Brazil is the reason those two countries dominate the production tables. The concentration of demand in a single country means that changes in Chinese construction policy, property sector health or steelmaking technology choices move the global market in ways that no other country's demand can match. The price series in the tables reflects this: the reference price is specifically the China import price for 62% Fe fines, CFR Tianjin.
A smaller but growing demand source appears in the end-markets table under grid storage. Iron-based battery chemistries, including iron-air batteries and lithium iron phosphate cells, use iron compounds in ways that are structurally different from steelmaking. The intensity figures in the table — iron in the cathode of an LFP battery pack, and iron as the balance of an NdFeB permanent magnet alloy — represent this second demand stream. For LFP batteries in particular, the iron used is a chemical-grade material rather than ore, so it passes through a different supply chain. At present this represents a small fraction of total iron ore consumption, but the direction of change is toward greater use as stationary energy storage expands.
Turning ore into product Ebene 3
Turning ore into product
The product that leaves an iron ore mine can take several forms, and the tables record them under the headings fines, lump, pellets and concentrate — each of which reflects a different degree of processing. Lump ore is simply crushed and screened to a size fraction that can be fed directly into a blast furnace or direct-reduction shaft. Fines are the smaller particles that result from crushing and from natural friability of the ore; they cannot be charged into most furnaces as they are because they restrict gas flow, so they are either sold at a discount or upgraded. Concentrate and pellets represent the fully processed end of the spectrum.
For magnetite and lower-grade hematite, the processing sequence begins with comminution — the staged grinding of ore in large mills until the iron-bearing minerals are liberated from the surrounding gangue, meaning the silica and other unwanted material. The ground slurry then passes through concentration, most commonly magnetic separation for magnetite (the mineral is strongly magnetic and can be pulled from the pulp by magnets) or a combination of gravity and flotation circuits for hematite. The result is a concentrate, typically 65–70% Fe, which is higher in iron content than most direct-shipping ore. This concentrate may then be filtered, mixed with a binder and formed into marble-sized balls called green pellets, which are fired in a kiln at high temperature to produce the hardened pellets that direct-reduction steelmaking plants prefer. Each processing step recovers a proportion of the iron in the feed and rejects the rest as tailings — fine waste slurry that must be stored, typically in engineered impoundments. The mass of tailings generated per tonne of concentrate is a function of the head grade: a lower-grade feed produces proportionally more tailings for the same amount of product.
Port infrastructure is part of the processing chain in a practical sense. Port Hedland in Western Australia and the Rotterdam bulk terminals both appear in the plant tables as processing nodes, because ore is blended to specification, sampled, moisture-adjusted and loaded at port. The 62% Fe benchmark used in pricing is assessed on the basis of material delivered into Chinese ports — CFR Tianjin — which is why the route from Pilbara or Carajás to a Chinese steel mill passes through both the mine-side and port-side stages before a tonne enters any price index.
Substitution and recycling Ebene 3
Substitution and recycling
There is no substitute for iron ore as the primary source of iron units in steelmaking — no other abundant mineral delivers iron at the volumes and costs that the industry requires. Within the steelmaking process, however, there is an important and large-scale form of substitution: scrap steel. Electric arc furnaces melt steel scrap back into liquid steel without any iron ore input at all. Scrap-based steelmaking currently accounts for a substantial share of global steel production, and in countries with mature industrial economies and well-developed collection infrastructure, it is the dominant route. The reason more steel is not made this way is partly a question of scrap availability — you can only recycle steel that has previously been made and has reached end of life — and partly a question of quality, since scrap carries residual elements such as copper and tin that are difficult to remove and that limit the range of steel products that can be reliably produced from a scrap-heavy charge.
The balance between primary production from ore and secondary production from scrap is therefore not simply a matter of economics or will: it is constrained by the stock of steel already in circulation and the rate at which it becomes available. Economies that are still building out their infrastructure are net accumulators of steel, meaning the metal is going into buildings and bridges rather than coming back out. The shift toward a higher scrap ratio happens naturally as those economies mature, but it plays out over decades rather than years. The direct-reduction route — which uses natural gas or hydrogen to reduce iron ore to a sponge iron, known as DRI or HBI, without a blast furnace — has grown in importance as an intermediate between ore-based and scrap-based steelmaking, and it is compatible with electric arc furnace melting. This route is more sensitive to the cost and availability of reducing gas than to anything specific about the ore itself, though it does favour the higher-grade pellets that magnetite concentrate processing produces.
Within the narrower category of iron-based battery materials, lithium iron phosphate cathode material uses iron in a very specific chemical form — iron phosphate — that is synthesised from chemical inputs rather than ore. The ore-to-battery supply chain passes through several chemical processing steps, and the iron source at those steps could in principle be scrap-derived iron or other industrial iron streams, not exclusively mined ore. This makes the battery demand for iron partially decoupled from the conventional ore market, though the scale is not yet large enough for this distinction to materially affect published ore statistics.
Where the chain is fragile Ebene 4
Where the chain is fragile
Iron ore is unusual among the materials on this site in that the primary supply risk is not scarcity of the resource itself — the reserve figures in the tables are very large relative to current annual production — but rather the geographical and corporate concentration of the seaborne trade. Australia alone accounts for the largest share of both production and reserves, and the three operators listed for the Pilbara — Rio Tinto, BHP, FMG and Hancock — collectively control a disproportionate share of the high-grade ore that trades internationally. Brazil's Carajás, operated by Vale, is the other anchor of the seaborne market. Disruptions at either origin — whether from weather events, infrastructure failures, regulatory action or geopolitical friction — propagate quickly through the price series, as the 2019 Brumadinho tailings dam failure in Brazil demonstrated when it removed a substantial volume of Brazilian supply from the market. The IMF price series in the data shows the resulting price movement in the 2019–2020 figures.
The unit-basis problem in the published statistics is a persistent source of confusion for analysts. The USGS data, as noted in the metadata, reports iron ore in two ways: as gross weight of usable ore and as iron content. These are not interchangeable, and the ratio between them varies by country depending on the average grade of ore produced. Australia's high-grade hematite raises its iron-content figure relative to its gross-weight figure by a different proportion than China's lower-grade magnetite does for China. Published reserve figures carry a further ambiguity: different national geological surveys apply different cut-off grades and different classification frameworks, and figures reported by mining companies in regulatory filings may be expressed in JORC, NI 43-101 or Russian GKZ conventions, none of which translate directly to one another. The world-total reserve figures in the tables aggregate across these conventions, which is why the precise numbers should be treated as indicative of order of magnitude rather than as precise measurements.
The processing bottleneck that receives the least attention in mainstream coverage is pellet and DRI-grade concentrate supply. Blast-furnace steelmaking can use a wide range of ore qualities, but direct-reduction steelmaking — which is the route most compatible with hydrogen-based low-emission steel — requires pellets made from high-purity concentrate, typically above 67% Fe and with low levels of silica, alumina and other gangue elements. The global capacity to produce pellet-feed concentrate of this quality is more limited than total iron ore supply figures suggest. A rapid scaling of DRI-based steelmaking would therefore create tightness in high-grade pellet feed even in an environment where headline iron ore supply appears ample. That structural mismatch — abundant ore in aggregate, constrained high-grade pellet feed specifically — is where the most substantive supply uncertainty sits over the medium term.
Wo es im Gestein vorkommt
Alle Erzminerale →Dies sind die Mineralien, die tatsächlich iron ore. Eine Lagerstätte ist nur dann ein Erzkörper, wenn eines der Minerale ausreichend konzentriert ist, um den Abbau wirtschaftlich zu rechtfertigen.
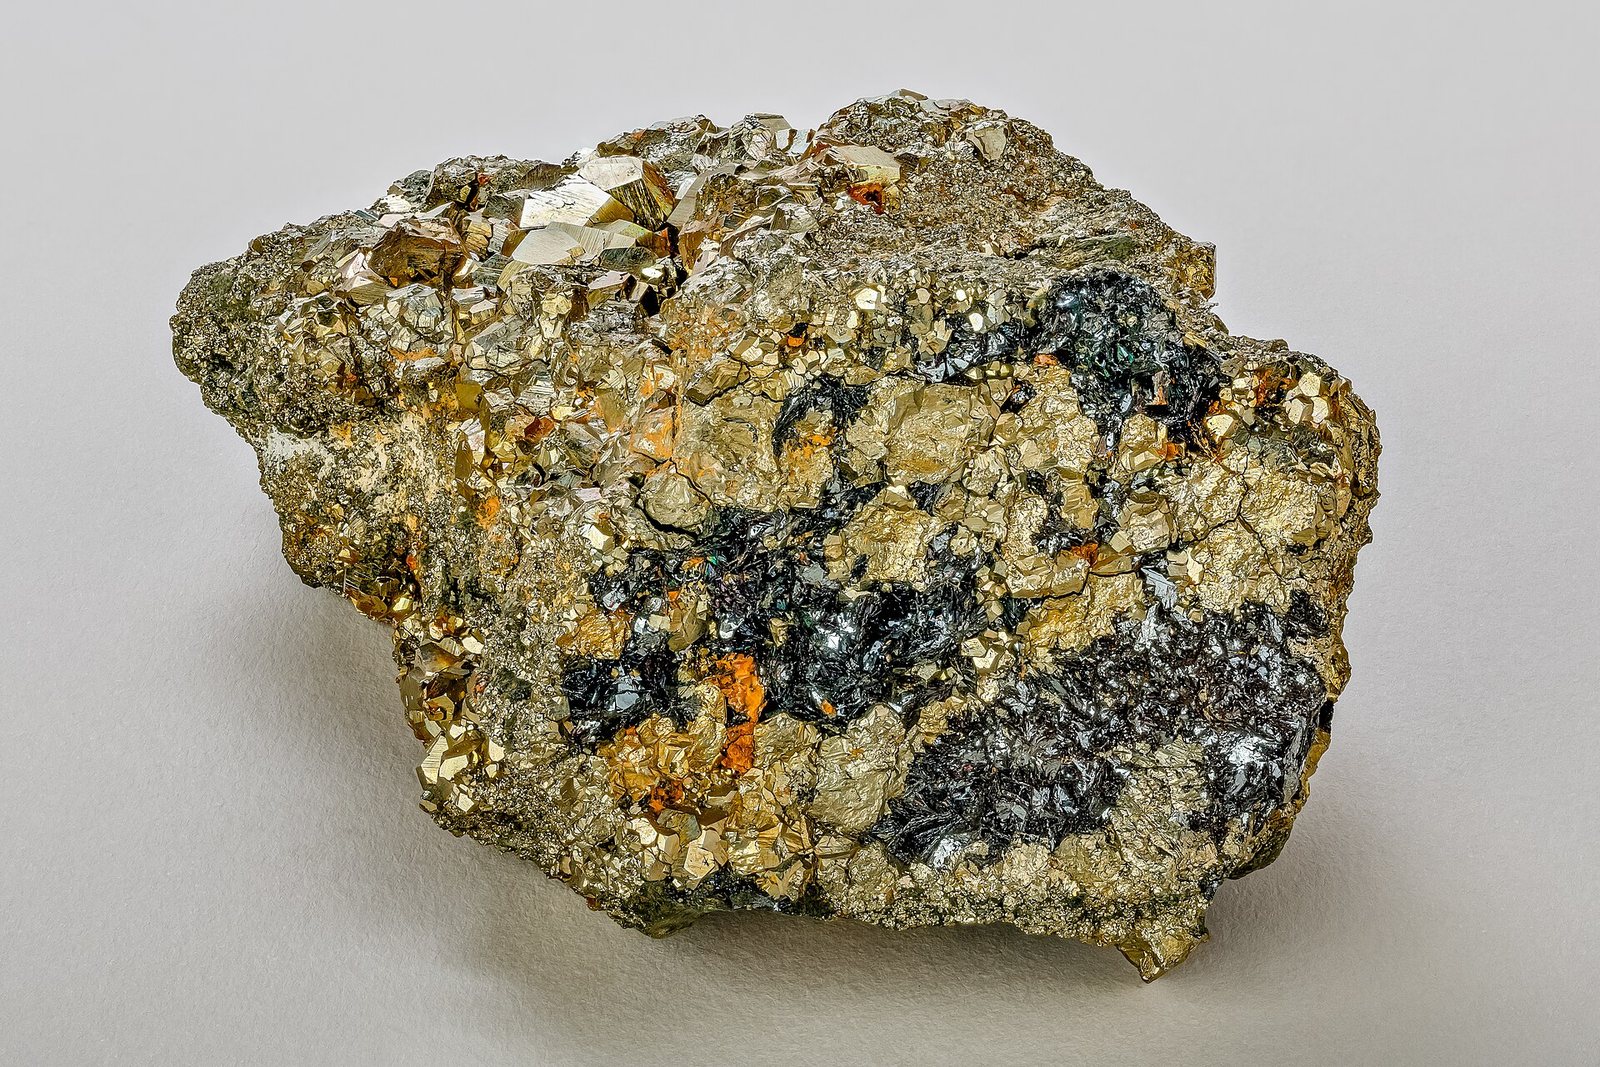
Hematite
70% iron when pure. Direct-shipping hematite ore needs little processing, which is why it built the Pilbara and Carajás.
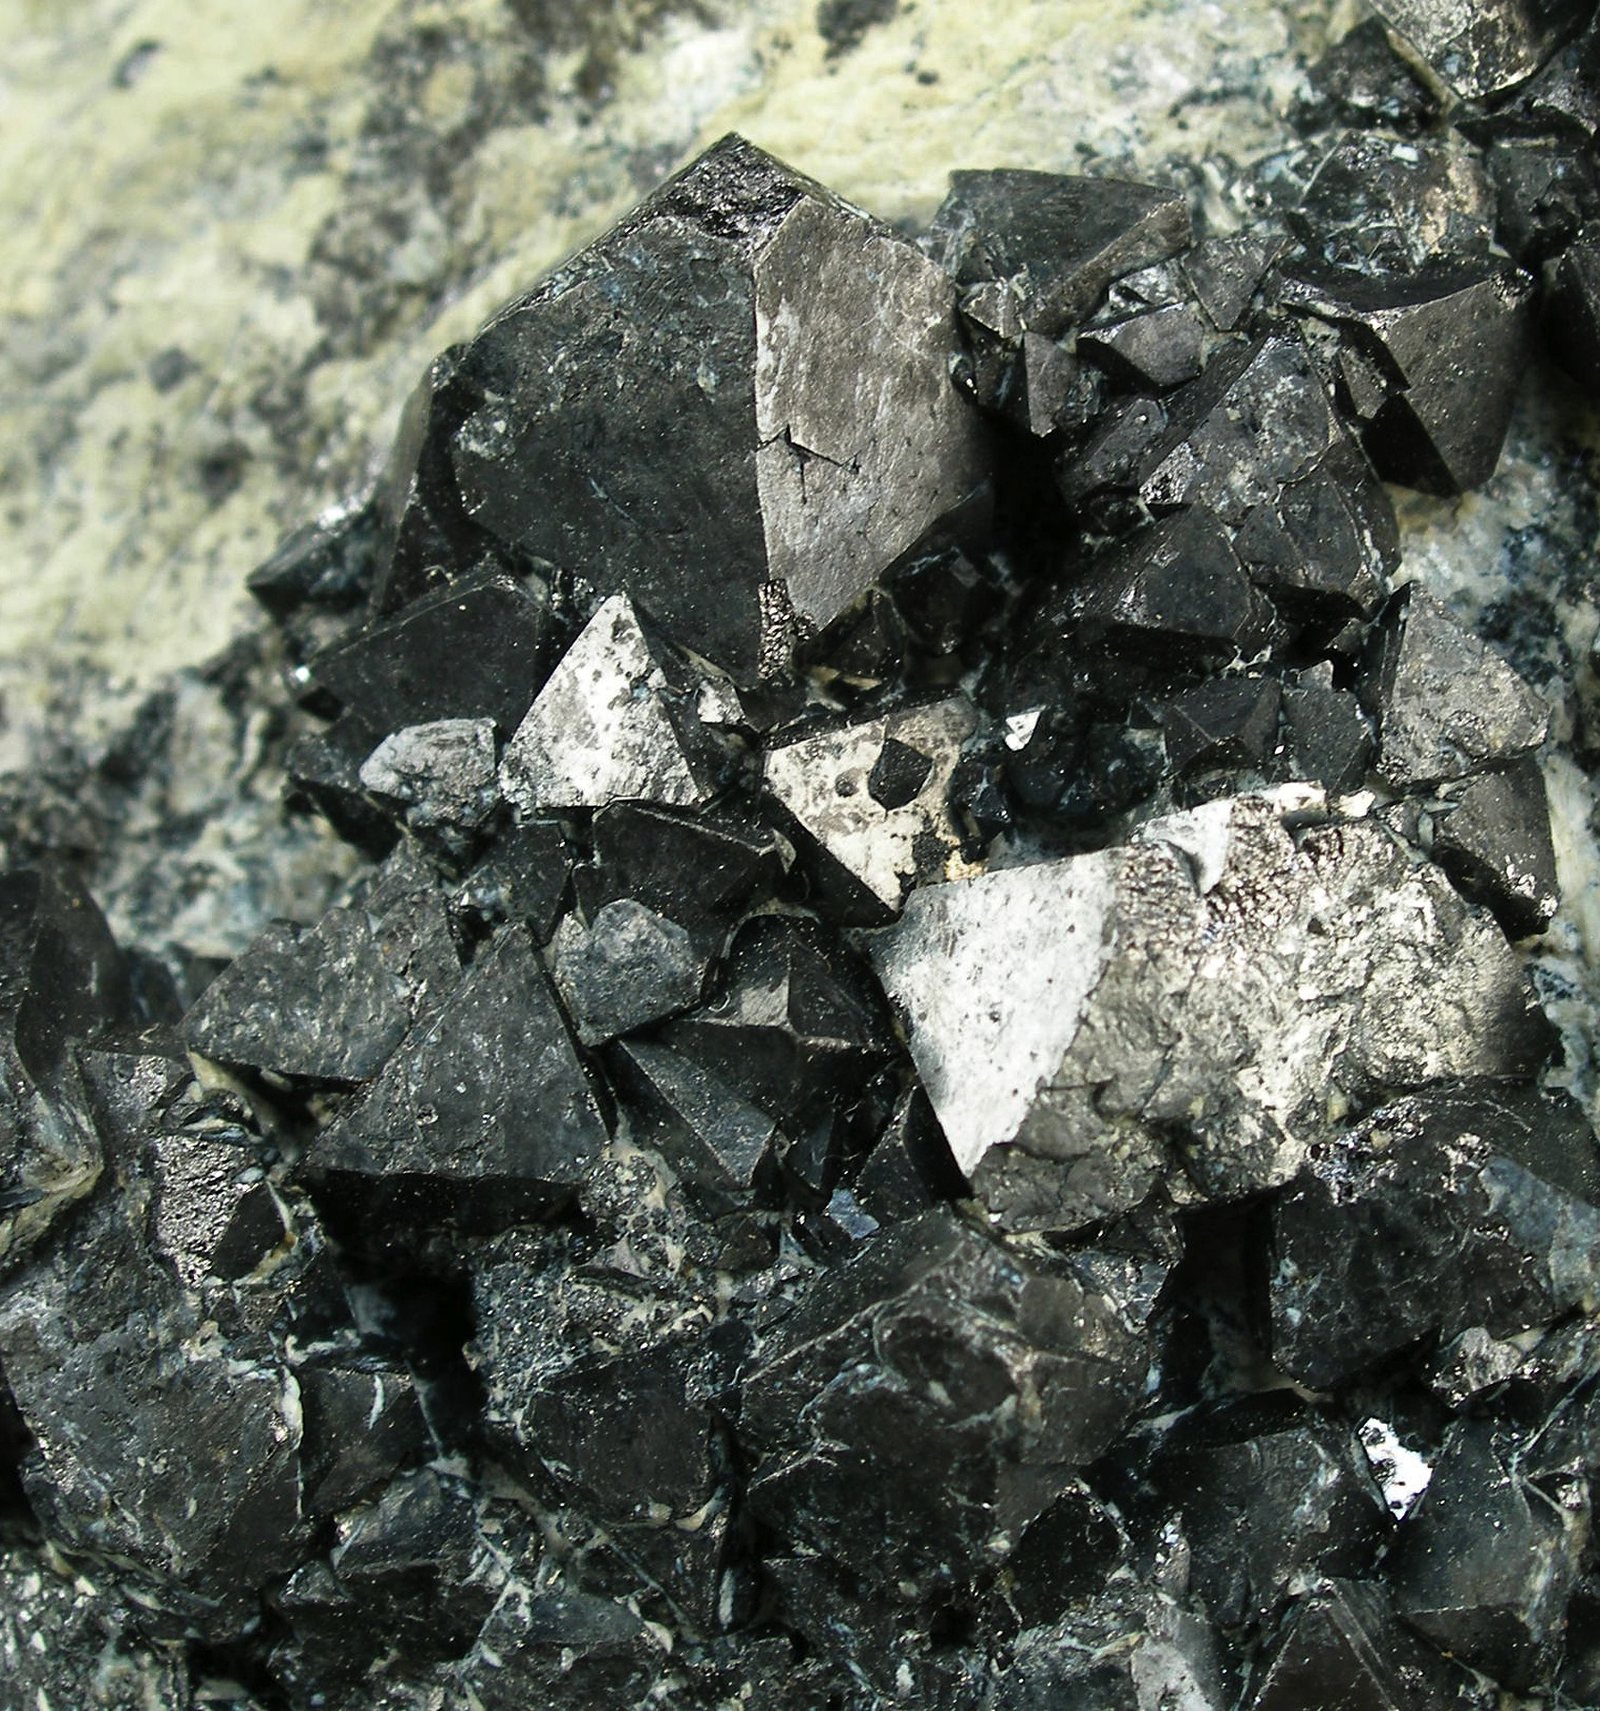
Magnetite
72% iron when pure but usually low grade in the ground; it is upgraded by magnetic separation into high-purity pellet…
Wer es produziert
Auf einer Karte anzeigen →Mine production: Iron content
Mine production: Iron contentthousand metric tons 2025 (geschätzt)
USGS Mineral Commodity Summaries 2026 · USGS iron-ore figures are usable ore (gross weight); a separate line gives iron content. Do not compare the two. · Quelle ↗
Tabelle seitwärts scrollen, um die restlichen Spalten zu sehen.
| Land | Produktion | Anteil an der Weltproduktion |
|---|---|---|
| Australia | 600,000 | — |
| Brazil | 260,000 | — |
| India | 190,000 | — |
| China | 180,000 | — |
| Iran | 61,000 | — |
| Russia | 50,000 | — |
| South Africa | 42,000 | — |
| Canada | 41,000 | — |
| Other countries | 36,000 | — |
| Ukraine | 32,000 | — |
| United States | 24,000 | — |
| Sweden | 18,000 | — |
| Peru | 14,000 | — |
| Chile | 12,000 | — |
| Kazakhstan | 11,000 | — |
| Turkey | 11,000 | — |
| Mauritania | 9,300 | — |
| Mexico | 4,800 | — |
Mine production: Iron content, rounded
Mine production: Iron content, roundedthousand metric tons 2025 (geschätzt) Weltgesamt 1,600,000 thousand metric tons
USGS Mineral Commodity Summaries 2026 · USGS iron-ore figures are usable ore (gross weight); a separate line gives iron content. Do not compare the two. · Quelle ↗
Tabelle seitwärts scrollen, um die restlichen Spalten zu sehen.
| Land | Produktion | Anteil an der Weltproduktion |
|---|---|---|
| Weltgesamt | 1,600,000 | 100% |
Mine production: Usable ore
Mine production: Usable orethousand metric tons 2025 (geschätzt)
USGS Mineral Commodity Summaries 2026 · USGS iron-ore figures are usable ore (gross weight); a separate line gives iron content. Do not compare the two. · Quelle ↗
Tabelle seitwärts scrollen, um die restlichen Spalten zu sehen.
| Land | Produktion | Anteil an der Weltproduktion |
|---|---|---|
| Australia | 980,000 | — |
| Brazil | 420,000 | — |
| India | 310,000 | — |
| China | 290,000 | — |
| Iran | 93,000 | — |
| Russia | 86,000 | — |
| Canada | 69,000 | — |
| South Africa | 66,000 | — |
| Other countries | 64,000 | — |
| Ukraine | 52,000 | — |
| United States | 38,000 | — |
| Kazakhstan | 35,000 | — |
| Sweden | 26,000 | — |
| Peru | 21,000 | — |
| Chile | 19,000 | — |
| Turkey | 18,000 | — |
| Mauritania | 15,000 | — |
| Mexico | 7,700 | — |
Mine production: Usable ore, rounded
Mine production: Usable ore, roundedthousand metric tons 2025 (geschätzt) Weltgesamt 2,600,000 thousand metric tons
USGS Mineral Commodity Summaries 2026 · USGS iron-ore figures are usable ore (gross weight); a separate line gives iron content. Do not compare the two. · Quelle ↗
Tabelle seitwärts scrollen, um die restlichen Spalten zu sehen.
| Land | Produktion | Anteil an der Weltproduktion |
|---|---|---|
| Weltgesamt | 2,600,000 | 100% |
„Withheld" bedeutet, dass der USGS den Wert zurückgehalten hat, um keine Rückschlüsse auf Daten einzelner Unternehmen zuzulassen – er bedeutet nicht null. Die Länderwerte addieren sich nicht immer zum Weltgesamt, weil die Quelle jeden Einzelwert unabhängig rundet und eine Zeile „sonstige Länder" nicht immer ausweist.
Wer die Reserven hält
Reserves (million metric tons): Crude ore
Reserves (million metric tons): Crude oremillion metric tons 2025
USGS Mineral Commodity Summaries 2026 · Quelle ↗
| Land | Reserven | Anteil an der Weltproduktion |
|---|---|---|
| Australia | 59,000 | — |
| Russia | 35,000 | — |
| Brazil | 34,000 | — |
| China | 17,000 | — |
| Other countries | 11,000 | — |
| Mauritania | 10,000 | — |
| Ukraine | 6,500 | — |
| Canada | 6,000 | — |
| India | 5,500 | — |
| Iran | 4,200 | — |
| Kazakhstan | 3,800 | — |
| United States | 3,600 | — |
| Chile | 3,000 | — |
| Peru | 1,800 | — |
| Sweden | 1,300 | — |
| South Africa | 1,200 | — |
| Mexico | 940.0 | — |
| Turkey | 150.0 | — |
Reserves (million metric tons): Crude ore, rounded
Reserves (million metric tons): Crude ore, roundedmillion metric tons 2025
USGS Mineral Commodity Summaries 2026 · Quelle ↗
| Land | Reserven | Anteil an der Weltproduktion |
|---|---|---|
| Weltgesamt | 200,000 | 100% |
Reserves (million metric tons): Iron content
Reserves (million metric tons): Iron contentmillion metric tons 2025
USGS Mineral Commodity Summaries 2026 · Quelle ↗
| Land | Reserven | Anteil an der Weltproduktion |
|---|---|---|
| Australia | 27,000 | — |
| Brazil | 15,000 | — |
| Russia | 14,000 | — |
| Other countries | 6,000 | — |
| Mauritania | 4,400 | — |
| India | 3,400 | — |
| China | 3,000 | — |
| United States | 2,700 | — |
| Ukraine | 2,300 | — |
| Canada | 2,300 | — |
| Iran | 1,500 | — |
| Kazakhstan | 1,500 | — |
| Peru | 1,000 | — |
| Chile | 740.0 | — |
| South Africa | 680.0 | — |
| Sweden | 600.0 | — |
| Mexico | 520.0 | — |
| Turkey | 99.00 | — |
Reserves (million metric tons): Iron content, rounded
Reserves (million metric tons): Iron content, roundedmillion metric tons 2025
USGS Mineral Commodity Summaries 2026 · Quelle ↗
| Land | Reserven | Anteil an der Weltproduktion |
|---|---|---|
| Weltgesamt | 87,000 | 100% |
Preis
Iron ore, global price
JahresdurchschnittUS$ per tonne
Grundlage: IMF global price of iron ore — China import, 62% Fe fines, CFR Tianjin. Jahresdurchschnitte gemäß Veröffentlichung in FRED (IMF primary commodity prices) · Quelle ↗. Dies sind jährliche Referenzdurchschnittswerte, kein Live-Marktpreis.
average unit value reported by mines, dollars per metric ton
Jahresdurchschnittdollars per metric ton
Grundlage: average unit value reported by mines, dollars per metric ton. Jahresdurchschnitte gemäß Veröffentlichung in USGS Mineral Commodity Summaries 2026 · Quelle ↗. Dies sind jährliche Referenzdurchschnittswerte, kein Live-Marktpreis.
Bergwerke, die es fördern
Alle Minen →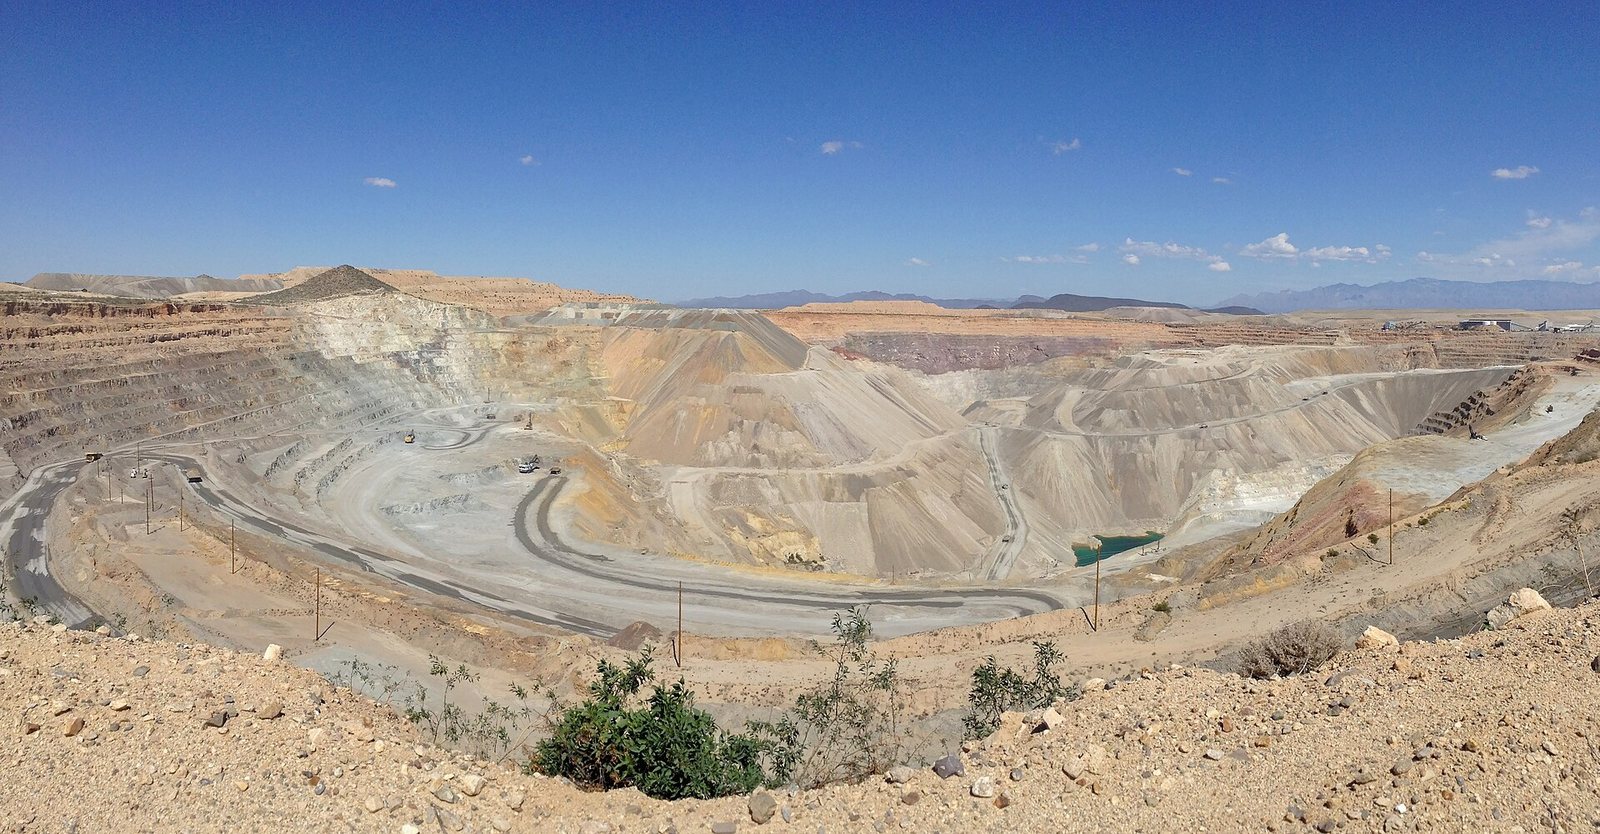
Pilbara Iron Ore District
The largest iron-ore export region in the world.
Bayan Obo
The largest rare-earth deposit in the world.
Wo es aufbereitet und raffiniert wird
| Anlage | Art | Stufe | Land | Rolle |
|---|---|---|---|---|
| Chinese NdFeB Magnet Cluster | Magnetwerk | Komponente | China | Input |
| Port Hedland | Hafen | Aufbereitung | Australia | Input |
| Port of Rotterdam Bulk Terminals | Hafen | Aufbereitung | Netherlands | Input |
Wofür es verwendet wird
Alle Endmärkte →| Endmarkt | Was es dort tut | Bedeutung |
|---|---|---|
| Construction & Steel | Steel | Definition |
| Grid Storage | Iron-air and iron-based chemistries | Wichtig |
Wie viel eine Technologie davon benötigt
| Technologie | Menge | Angegeben | Grundlage |
|---|---|---|---|
| LFP Lithium-Ion Battery | 25.00–45.00 kg | per 75 kWh pack | Iron in the cathode |
| NdFeB Permanent Magnet | 0.6–0.7 kg | per kg of finished magnet | Iron balance of the alloy |
Indicative range compiled from published technology studies and chemistry; verify against a manufacturer specification before use. Diese Zahlen mit beliebiger Skalierung im Materialrechner ausführen →
Exportkontrollen
| Land | Kontrolle | Gilt für |
|---|---|---|
| Laos | Export ban | Raw minerals, including copper, gold, iron, nickel, potassium, silver, and zinc (2024). ↗ |
| Vietnam | Export ban | Raw materials of iron, lead-zinc, chromite, manganese, apatite, and rare earths and deeply processed titanium (2012). ↗ |
USGS Mineral Commodity Summaries 2026, table 4 — controls in effect as of January 2026, excluding controls since lifted.
Grenzenübergreifend verfolgen
Alle Routen →Wo eine Sendung dieses Materials tatsächlich hingeht — jedes Land, jeder Verwahrer und was bei jedem Schritt zurückbleibt.
Pilbara iron ore to Chinese steel The largest material flow on Earth: dig it, crush it, screen it, and put it on a boat.