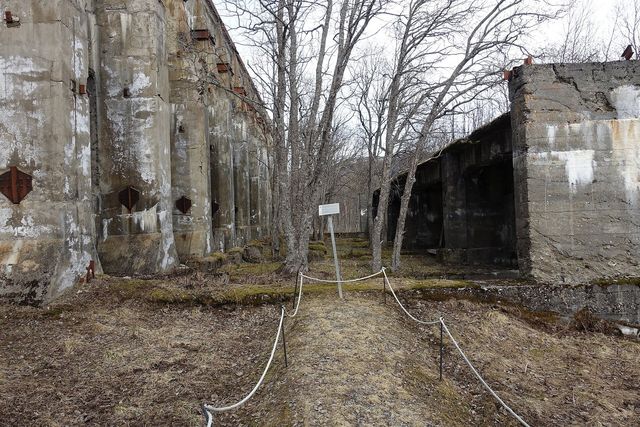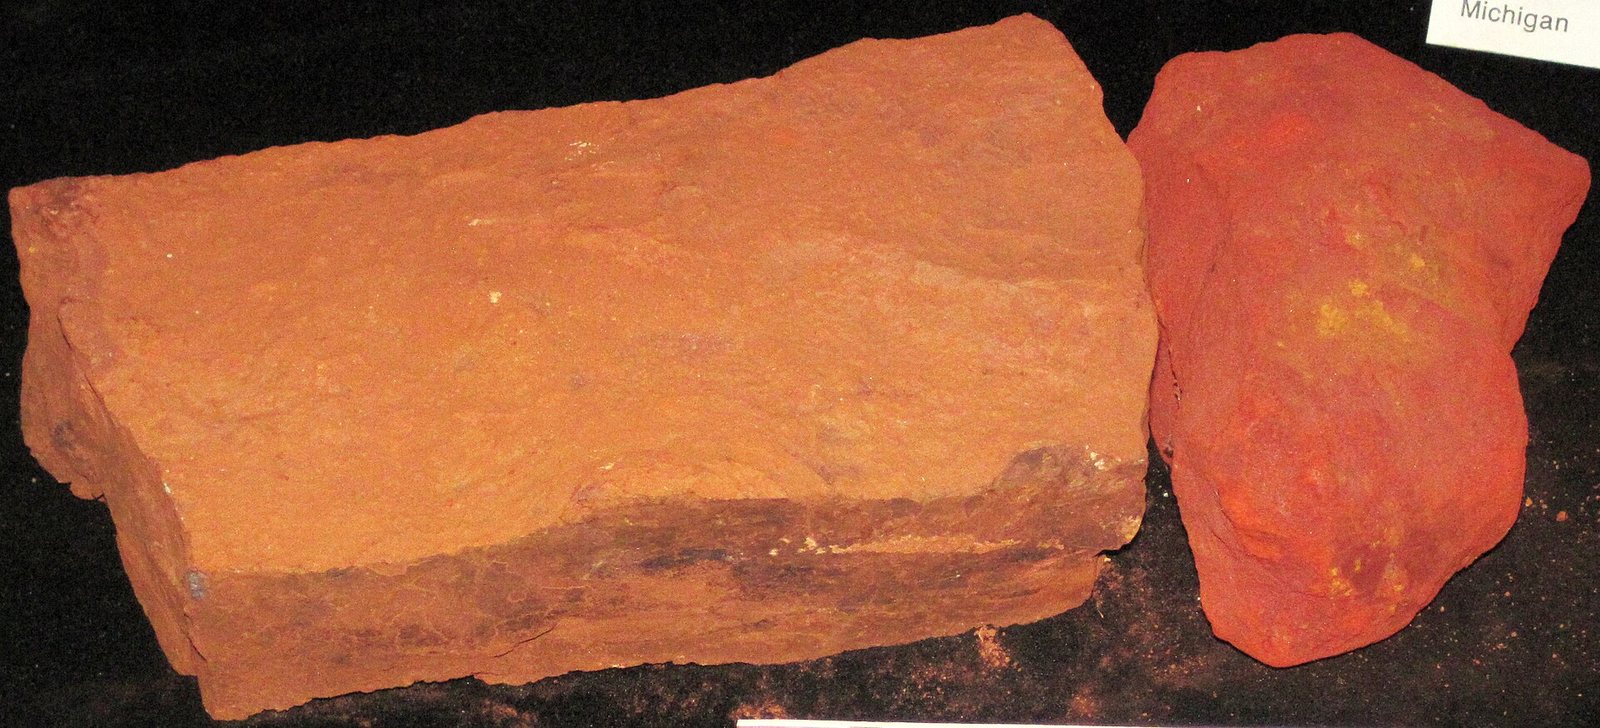
Wat is het?
Rust-coloured rock that is roughly one-third to two-thirds iron, and the single largest tonnage the mining industry moves.
Waarom is het van belang?
Steel is about ninety-five percent of all metal used by weight. Everything else on this site is, by tonnage, a rounding error next to iron.
Uitgebreidere geschreven secties voor dit materiaal zijn nog niet gepubliceerd. Alles hieronder is rechtstreeks afkomstig uit de brondatasets en is volledig.
Waar het in het gesteente vandaan komt
Alle ertsmineralen →Dit zijn de mineralen die daadwerkelijk iron ore. Een afzetting is alleen een ertslichaam als een van beide voldoende geconcentreerd is om de winning ervan te bekostigen.
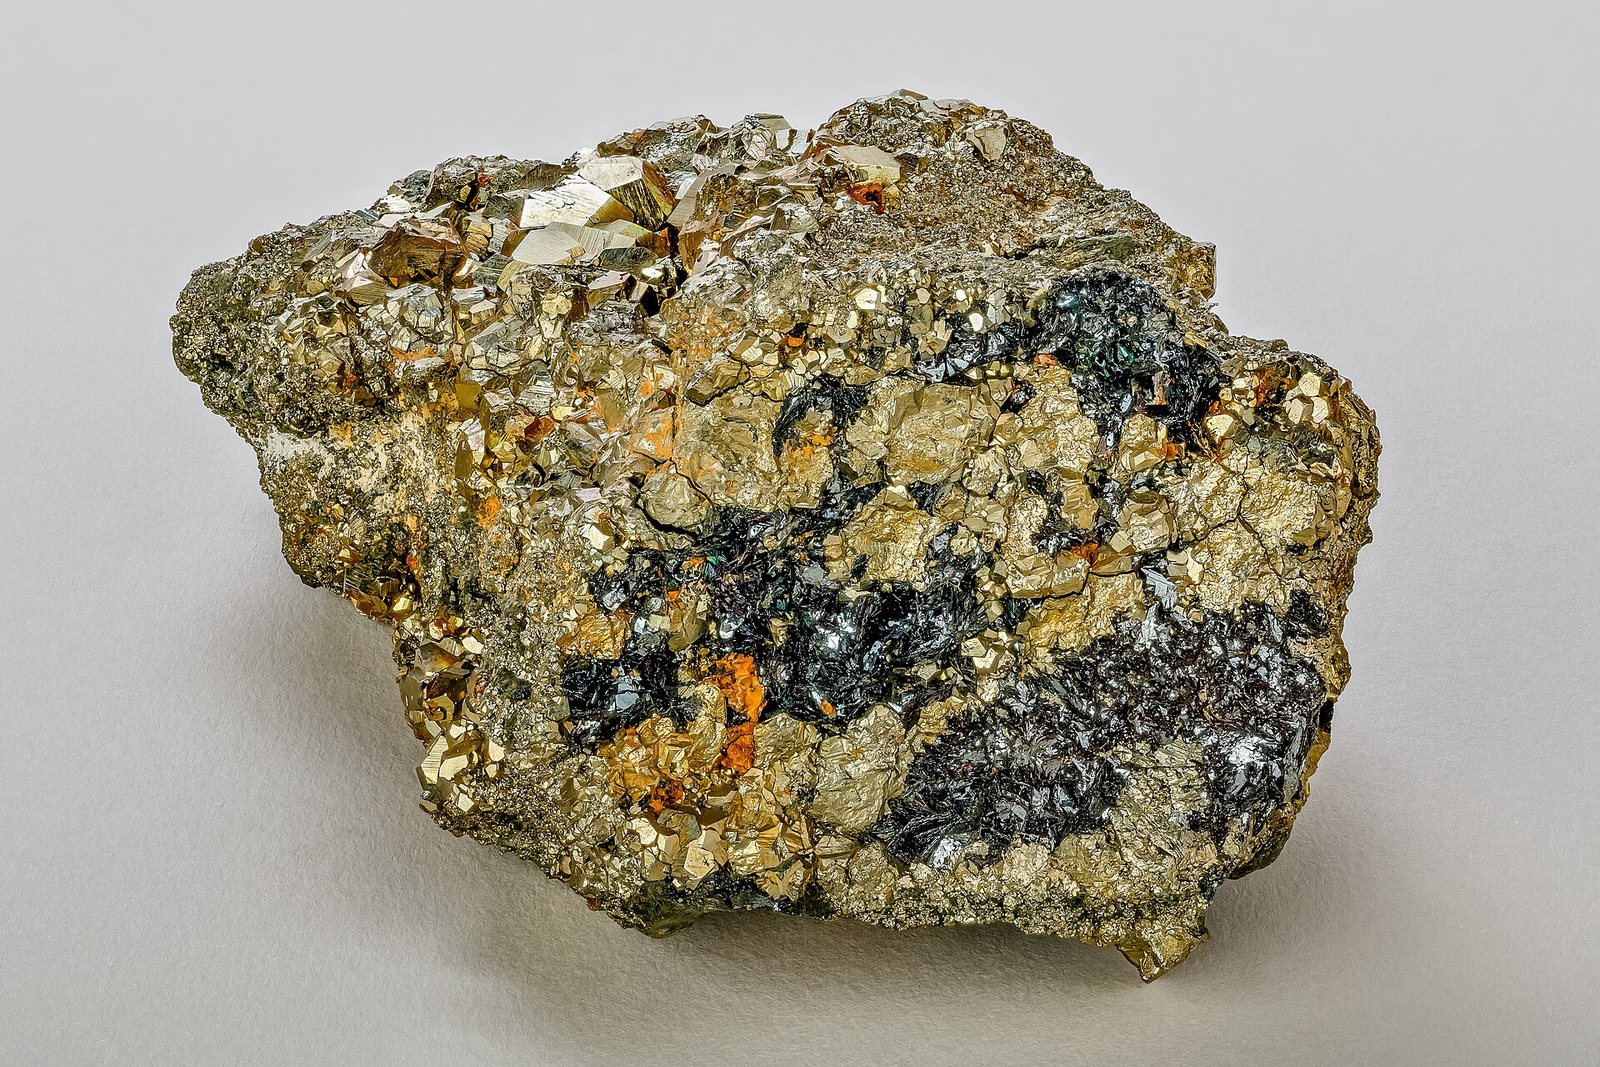
Hematite
70% iron when pure. Direct-shipping hematite ore needs little processing, which is why it built the Pilbara and Carajás.
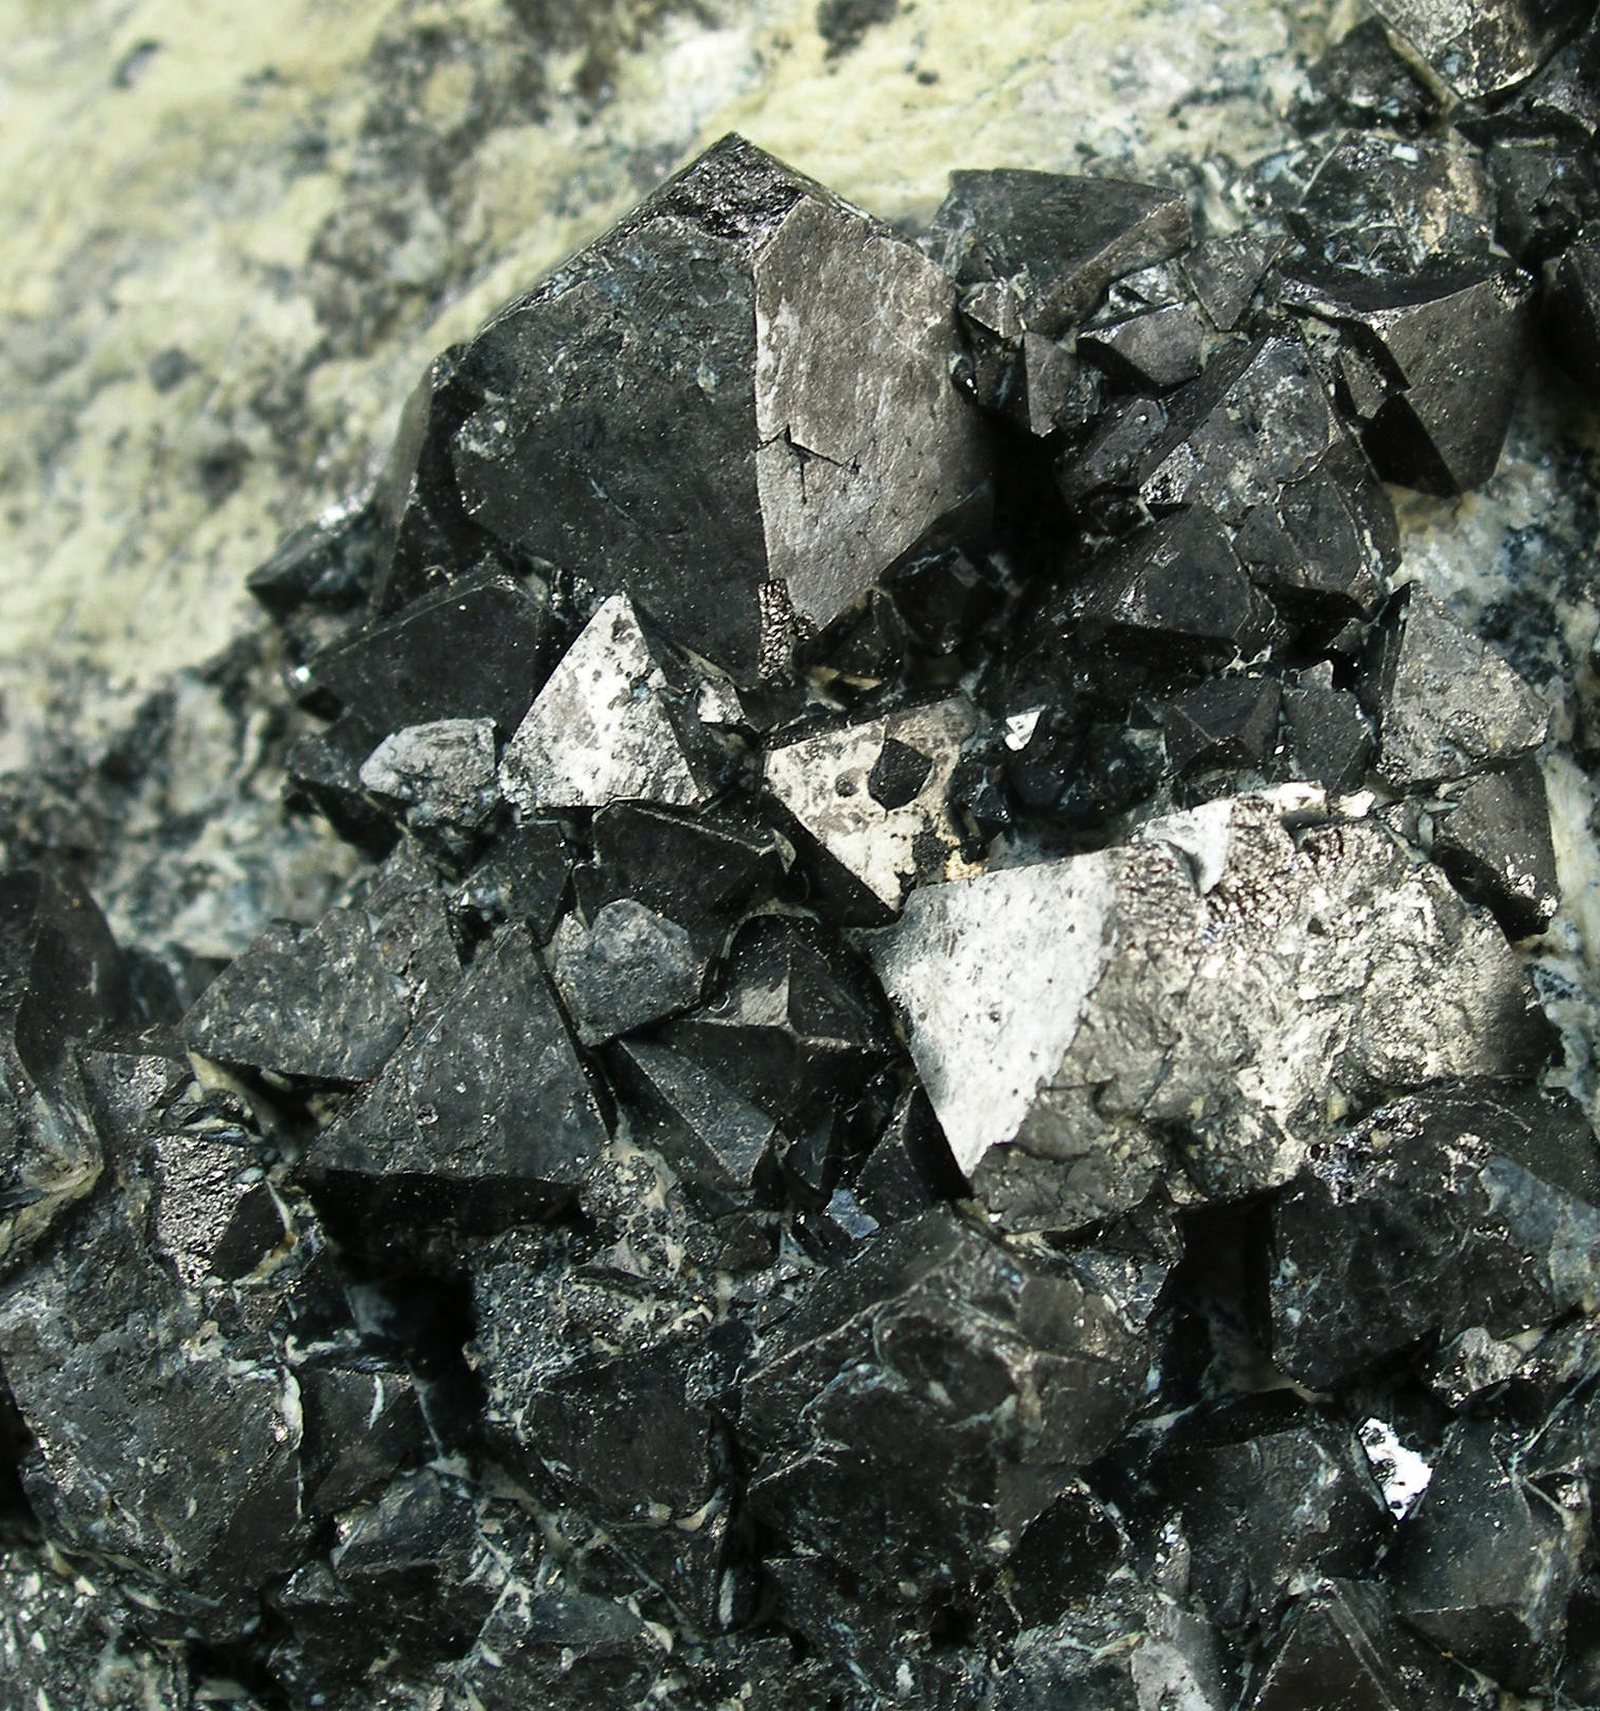
Magnetite
72% iron when pure but usually low grade in the ground; it is upgraded by magnetic separation into high-purity pellet…
Wie het produceert
Bekijk het op een kaart →Mine production: Iron content
Mine production: Iron contentthousand metric tons 2025 (geschat)
USGS Mineral Commodity Summaries 2026 · USGS iron-ore figures are usable ore (gross weight); a separate line gives iron content. Do not compare the two. · bron ↗
Schuif de tabel zijwaarts voor de overige kolommen.
| Land | Productie | Aandeel van de wereld |
|---|---|---|
| Australia | 600,000 | — |
| Brazil | 260,000 | — |
| India | 190,000 | — |
| China | 180,000 | — |
| Iran | 61,000 | — |
| Russia | 50,000 | — |
| South Africa | 42,000 | — |
| Canada | 41,000 | — |
| Other countries | 36,000 | — |
| Ukraine | 32,000 | — |
| United States | 24,000 | — |
| Sweden | 18,000 | — |
| Peru | 14,000 | — |
| Chile | 12,000 | — |
| Kazakhstan | 11,000 | — |
| Turkey | 11,000 | — |
| Mauritania | 9,300 | — |
| Mexico | 4,800 | — |
Mine production: Iron content, rounded
Mine production: Iron content, roundedthousand metric tons 2025 (geschat) Wereldtotaal 1,600,000 thousand metric tons
USGS Mineral Commodity Summaries 2026 · USGS iron-ore figures are usable ore (gross weight); a separate line gives iron content. Do not compare the two. · bron ↗
Schuif de tabel zijwaarts voor de overige kolommen.
| Land | Productie | Aandeel van de wereld |
|---|---|---|
| Wereldtotaal | 1,600,000 | 100% |
Mine production: Usable ore
Mine production: Usable orethousand metric tons 2025 (geschat)
USGS Mineral Commodity Summaries 2026 · USGS iron-ore figures are usable ore (gross weight); a separate line gives iron content. Do not compare the two. · bron ↗
Schuif de tabel zijwaarts voor de overige kolommen.
| Land | Productie | Aandeel van de wereld |
|---|---|---|
| Australia | 980,000 | — |
| Brazil | 420,000 | — |
| India | 310,000 | — |
| China | 290,000 | — |
| Iran | 93,000 | — |
| Russia | 86,000 | — |
| Canada | 69,000 | — |
| South Africa | 66,000 | — |
| Other countries | 64,000 | — |
| Ukraine | 52,000 | — |
| United States | 38,000 | — |
| Kazakhstan | 35,000 | — |
| Sweden | 26,000 | — |
| Peru | 21,000 | — |
| Chile | 19,000 | — |
| Turkey | 18,000 | — |
| Mauritania | 15,000 | — |
| Mexico | 7,700 | — |
Mine production: Usable ore, rounded
Mine production: Usable ore, roundedthousand metric tons 2025 (geschat) Wereldtotaal 2,600,000 thousand metric tons
USGS Mineral Commodity Summaries 2026 · USGS iron-ore figures are usable ore (gross weight); a separate line gives iron content. Do not compare the two. · bron ↗
Schuif de tabel zijwaarts voor de overige kolommen.
| Land | Productie | Aandeel van de wereld |
|---|---|---|
| Wereldtotaal | 2,600,000 | 100% |
"Ingehouden" betekent dat de USGS het cijfer heeft onderdrukt om gegevens van een individueel bedrijf niet prijs te geven — het betekent niet nul. Landrijen tellen niet altijd op tot het wereldtotaal, omdat de bron elk cijfer afzonderlijk afrondt en niet altijd een regel "overige landen" uitsplitst.
Wie de reserves bezit
Reserves (million metric tons): Crude ore
Reserves (million metric tons): Crude oremillion metric tons 2025
USGS Mineral Commodity Summaries 2026 · bron ↗
| Land | Reserves | Aandeel van de wereld |
|---|---|---|
| Australia | 59,000 | — |
| Russia | 35,000 | — |
| Brazil | 34,000 | — |
| China | 17,000 | — |
| Other countries | 11,000 | — |
| Mauritania | 10,000 | — |
| Ukraine | 6,500 | — |
| Canada | 6,000 | — |
| India | 5,500 | — |
| Iran | 4,200 | — |
| Kazakhstan | 3,800 | — |
| United States | 3,600 | — |
| Chile | 3,000 | — |
| Peru | 1,800 | — |
| Sweden | 1,300 | — |
| South Africa | 1,200 | — |
| Mexico | 940.0 | — |
| Turkey | 150.0 | — |
Reserves (million metric tons): Crude ore, rounded
Reserves (million metric tons): Crude ore, roundedmillion metric tons 2025
USGS Mineral Commodity Summaries 2026 · bron ↗
| Land | Reserves | Aandeel van de wereld |
|---|---|---|
| Wereldtotaal | 200,000 | 100% |
Reserves (million metric tons): Iron content
Reserves (million metric tons): Iron contentmillion metric tons 2025
USGS Mineral Commodity Summaries 2026 · bron ↗
| Land | Reserves | Aandeel van de wereld |
|---|---|---|
| Australia | 27,000 | — |
| Brazil | 15,000 | — |
| Russia | 14,000 | — |
| Other countries | 6,000 | — |
| Mauritania | 4,400 | — |
| India | 3,400 | — |
| China | 3,000 | — |
| United States | 2,700 | — |
| Ukraine | 2,300 | — |
| Canada | 2,300 | — |
| Iran | 1,500 | — |
| Kazakhstan | 1,500 | — |
| Peru | 1,000 | — |
| Chile | 740.0 | — |
| South Africa | 680.0 | — |
| Sweden | 600.0 | — |
| Mexico | 520.0 | — |
| Turkey | 99.00 | — |
Reserves (million metric tons): Iron content, rounded
Reserves (million metric tons): Iron content, roundedmillion metric tons 2025
USGS Mineral Commodity Summaries 2026 · bron ↗
| Land | Reserves | Aandeel van de wereld |
|---|---|---|
| Wereldtotaal | 87,000 | 100% |
Prijs
Iron ore, global price
JaargemiddeldeUS$ per tonne
Grondslag: IMF global price of iron ore — China import, 62% Fe fines, CFR Tianjin. Jaargemiddelden zoals gepubliceerd in FRED (IMF primary commodity prices) · bron ↗. Dit zijn referentiejaargemiddelden, geen live marktkoers.
average unit value reported by mines, dollars per metric ton
Jaargemiddeldedollars per metric ton
Grondslag: average unit value reported by mines, dollars per metric ton. Jaargemiddelden zoals gepubliceerd in USGS Mineral Commodity Summaries 2026 · bron ↗. Dit zijn referentiejaargemiddelden, geen live marktkoers.
Mijnen die het produceren
Alle mijnen →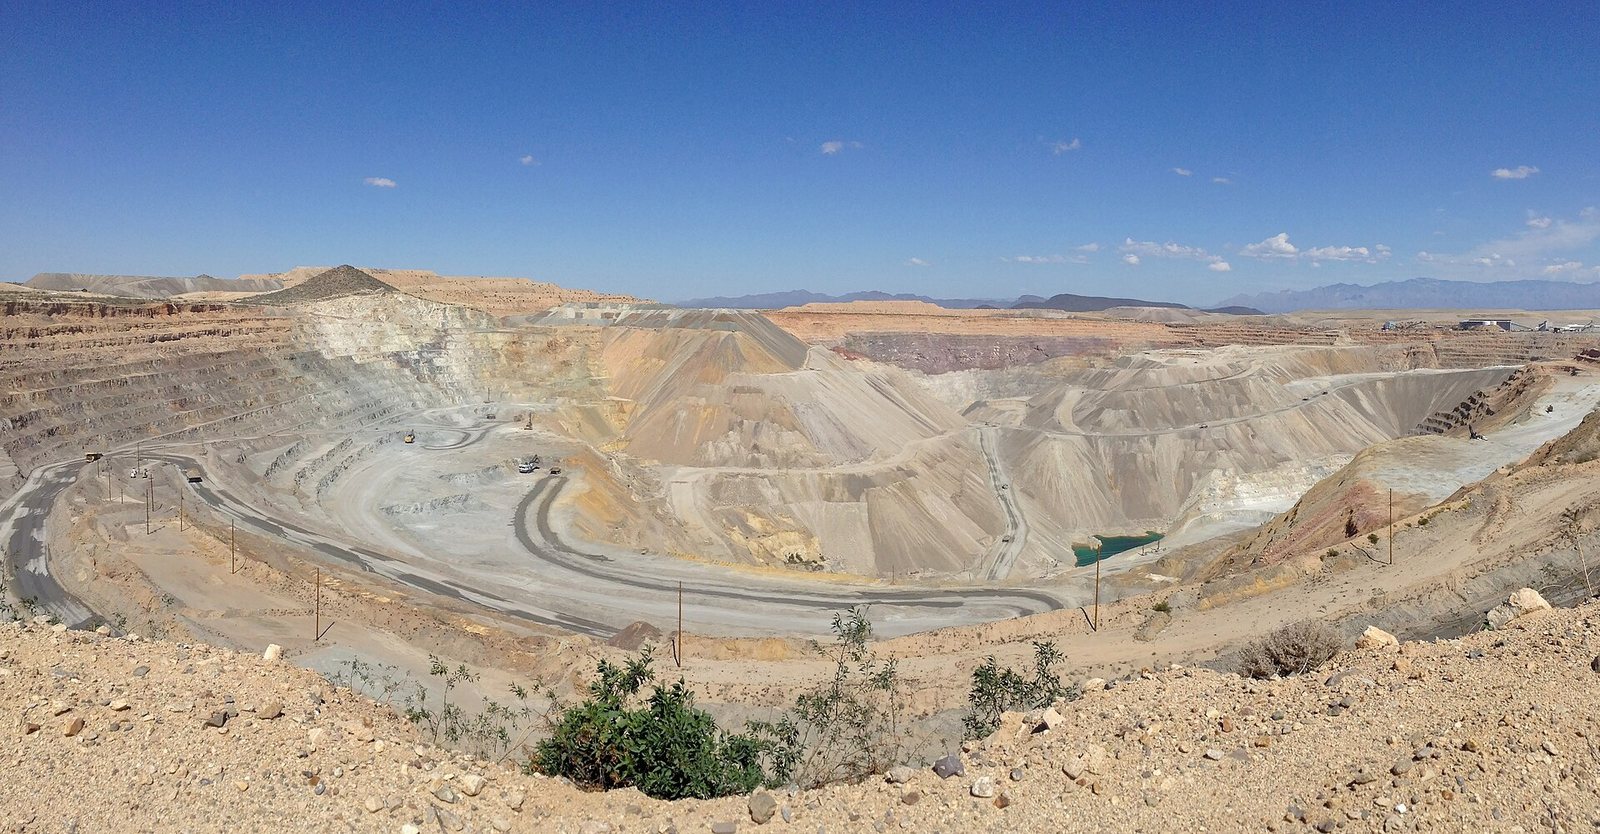
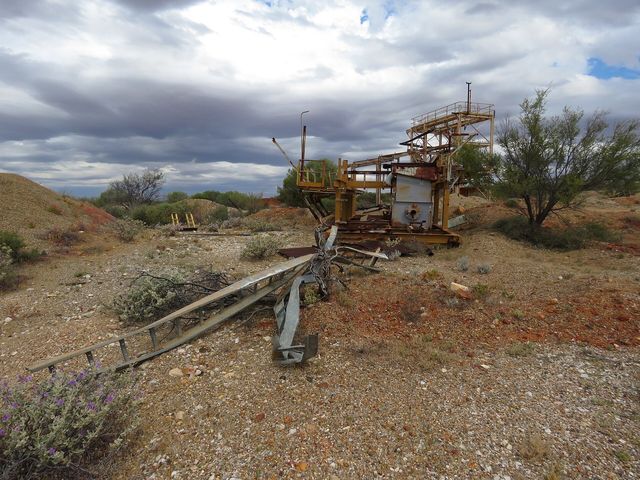
Pilbara Iron Ore District
The largest iron-ore export region in the world.
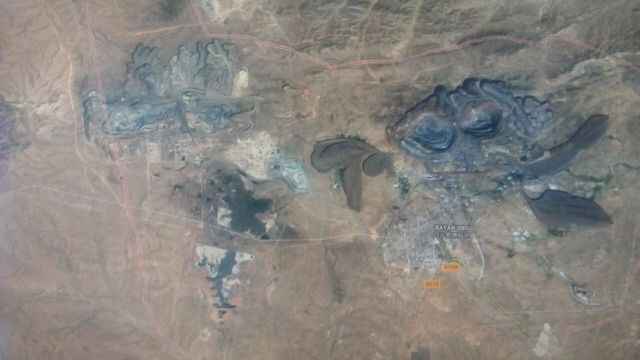
Bayan Obo
The largest rare-earth deposit in the world.
Waar het wordt verwerkt en geraffineerd
| Installatie | Soort | Fase | Land | Rol |
|---|---|---|---|---|
| Chinese NdFeB Magnet Cluster | Magneetfabriek | Component | China | Invoer |
| Port Hedland | Haven | Verwerking | Australia | Invoer |
| Port of Rotterdam Bulk Terminals | Haven | Verwerking | Netherlands | Invoer |
Waarvoor het wordt gebruikt
Alle eindmarkten →| Eindmarkt | Wat het daar doet | Belang |
|---|---|---|
| Construction & Steel | Steel | Definiëren |
| Grid Storage | Iron-air and iron-based chemistries | Belangrijk |
Hoeveel een technologie ervan nodig heeft
| Technologie | Hoeveelheid | Genoteerd | Grondslag |
|---|---|---|---|
| LFP Lithium-Ion Battery | 25.00–45.00 kg | per 75 kWh pack | Iron in the cathode |
| NdFeB Permanent Magnet | 0.6–0.7 kg | per kg of finished magnet | Iron balance of the alloy |
Indicative range compiled from published technology studies and chemistry; verify against a manufacturer specification before use. Voer deze getallen op elke schaal uit in de materiaalcalculator →
Exportbeperkingen
| Land | Controle | Van toepassing op |
|---|---|---|
| Laos | Export ban | Raw minerals, including copper, gold, iron, nickel, potassium, silver, and zinc (2024). ↗ |
| Vietnam | Export ban | Raw materials of iron, lead-zinc, chromite, manganese, apatite, and rare earths and deeply processed titanium (2012). ↗ |
USGS Mineral Commodity Summaries 2026, table 4 — controls in effect as of January 2026, excluding controls since lifted.
Volg het over de grenzen
Alle trajecten →Waar een zending van dit materiaal werkelijk naartoe gaat — elk land, elke bewaarder, en wat er bij elke stap achterblijft.
Pilbara iron ore to Chinese steel The largest material flow on Earth: dig it, crush it, screen it, and put it on a boat.