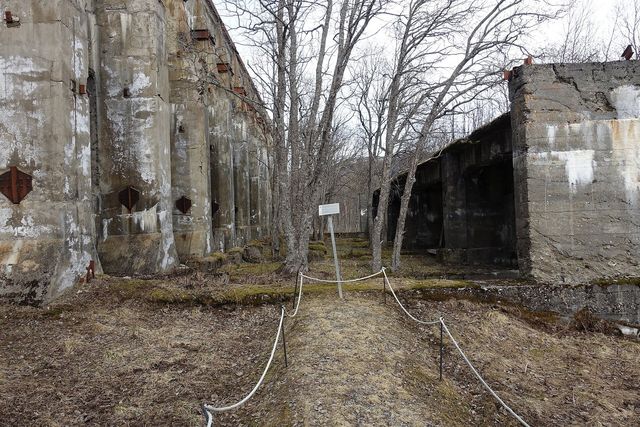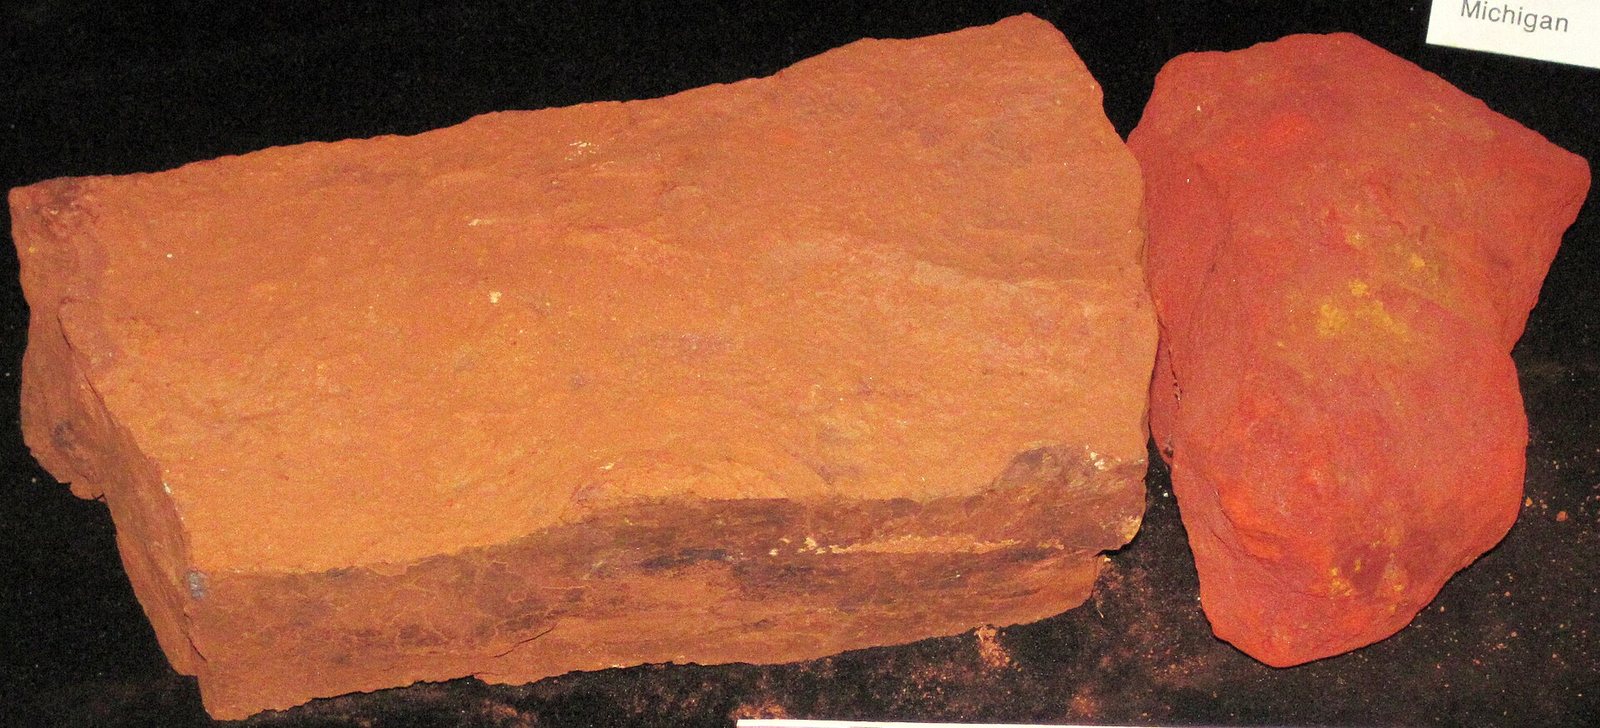
这是什么?
Rust-coloured rock that is roughly one-third to two-thirds iron, and the single largest tonnage the mining industry moves.
为何重要?
Steel is about ninety-five percent of all metal used by weight. Everything else on this site is, by tonnage, a rounding error next to iron.
Where it is in the Earth
Where it is in the Earth
Almost all of the iron ore mined today came into existence during a narrow window of geological time, roughly two to two and a half billion years ago, when Earth's oceans were still largely free of dissolved oxygen. Iron-bearing fluids, released by submarine volcanic activity, reacted with oxygen produced by early photosynthetic organisms. The iron oxidised and settled to the seafloor in thin, alternating layers of iron-rich minerals and chert — a fine-grained silica rock. Over geological time these sediments were buried, compacted and sometimes heated, producing the characteristic banded appearance that gives the rock its name: banded iron formation, or BIF. This rock type is the source of the overwhelming majority of the world's iron ore reserves and virtually all of the large-scale mining operations the tables on this page describe.
BIF on its own is not always economic to mine directly, because its iron content can be too dilute. What makes a deposit mineable is secondary enrichment — a later process in which groundwater, over tens of millions of years, dissolves away the silica and concentrates the iron minerals into a softer, higher-grade mass. The two minerals that result from this are hematite, an oxide with the formula Fe₂O₃, and magnetite, an oxide with the formula Fe₃O₄. Hematite-enriched BIF, where the iron content has risen to the point at which the ore can be loaded onto a ship without further treatment, is called direct-shipping ore. Australia's Pilbara region and Brazil's Carajás district are the world's pre-eminent examples of this type. Magnetite deposits, found across much of China and parts of Russia and other countries, tend to be lower in iron content as mined and require concentration at the mine site before they can be used.
The geography of reserves follows directly from the distribution of ancient BIF sequences. Australia holds the largest reported reserves in the tables, with Brazil and Russia close behind. These numbers reflect both the original extent of ancient seafloor sediments and the degree to which later enrichment has raised grades to economic levels. China appears in both the production and reserve tables, but its domestic ore tends to be lower-grade magnetite rather than the high-grade hematite that trades internationally, which is why China remains a very large importer despite substantial domestic output.
Getting it out
Getting it out
Iron ore is almost universally mined in open pits — large, stepped excavations that remove rock from the surface downward. The reason is straightforward: BIF-hosted deposits are often very large in areal extent but relatively shallow, making open-pit mining far cheaper than sinking shafts and developing underground workings. The ore is drilled, blasted, loaded into large trucks and driven to a crusher or, in the case of direct-shipping ore, to a screening and loading facility. The mines listed in the tables — the Pilbara district, Carajás, and Bayan Obo — are all open-pit operations, and they are among the largest volume-moving industrial operations on Earth.
Grade is the central economic fact of any ore deposit. In iron ore, grade is expressed as a percentage of iron by weight, written as Fe%. The benchmark that the traded market uses is 62% Fe — meaning 62 parts of iron in every 100 parts of ore. Direct-shipping hematite ore from the Pilbara and Carajás typically falls within or close to that range as it leaves the ground, which is why it can be shipped and sold with minimal processing. Magnetite ore, by contrast, is commonly mined at grades well below the traded benchmark. The gap between the mined grade and the saleable grade has to be closed by processing, which costs money and energy. The amount of material that must be moved to obtain a tonne of saleable product — including waste rock that contains no ore at all — varies enormously between deposits and is a primary driver of operating cost.
One exception to the open-pit pattern is Bayan Obo in Inner Mongolia, which is geologically unusual: it is hosted in a carbonatite, a rare igneous rock type, and carries iron alongside rare-earth elements and niobium. That makes it a polymetallic deposit where the economics of each commodity affect the others, and where the mining method and the processing flowsheet are more complicated than at a straightforward BIF hematite operation.
What pulls on it
What pulls on it
Iron ore is almost entirely a steel-making raw material. Steel production is the end market listed in the tables, and the connection is direct: iron ore is charged into a blast furnace with coke and limestone, the iron is reduced out of the oxide, and the resulting pig iron is refined into steel. There is no meaningful substitute for iron ore in this process, and steel is so deeply embedded in construction, transport, machinery and energy infrastructure that demand for iron ore broadly tracks global construction and manufacturing activity. When large economies are building rapidly — roads, bridges, buildings, railways — iron ore demand rises. When construction slows, it falls.
China is the central fact of the modern iron ore market. It accounts for roughly half of global steel production by most external estimates, and its reliance on seaborne iron ore from Australia and Brazil is the reason those two countries dominate the production tables. The concentration of demand in a single country means that changes in Chinese construction policy, property sector health or steelmaking technology choices move the global market in ways that no other country's demand can match. The price series in the tables reflects this: the reference price is specifically the China import price for 62% Fe fines, CFR Tianjin.
A smaller but growing demand source appears in the end-markets table under grid storage. Iron-based battery chemistries, including iron-air batteries and lithium iron phosphate cells, use iron compounds in ways that are structurally different from steelmaking. The intensity figures in the table — iron in the cathode of an LFP battery pack, and iron as the balance of an NdFeB permanent magnet alloy — represent this second demand stream. For LFP batteries in particular, the iron used is a chemical-grade material rather than ore, so it passes through a different supply chain. At present this represents a small fraction of total iron ore consumption, but the direction of change is toward greater use as stationary energy storage expands.
其在岩石中的来源
所有含矿矿物 →实际承载以下内容的矿物: iron ore. 只有其中某种物质的富集程度足以覆盖开采成本,矿床才能成为矿体。
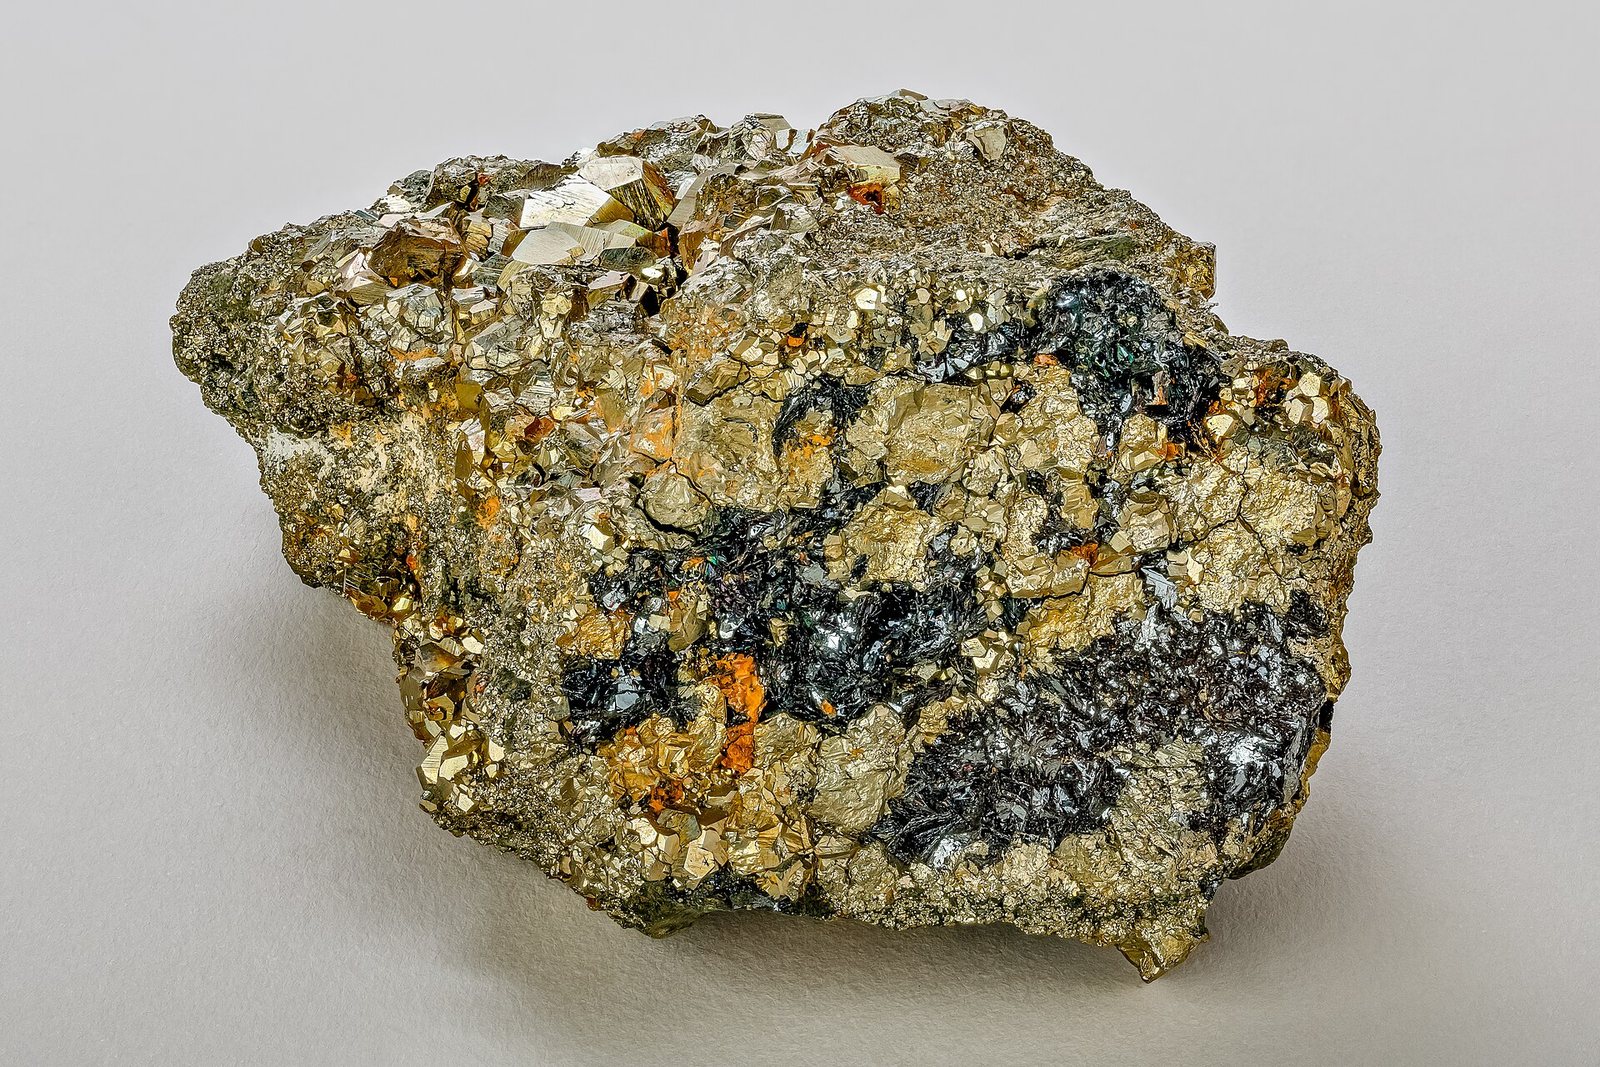
Hematite
70% iron when pure. Direct-shipping hematite ore needs little processing, which is why it built the Pilbara and Carajás.
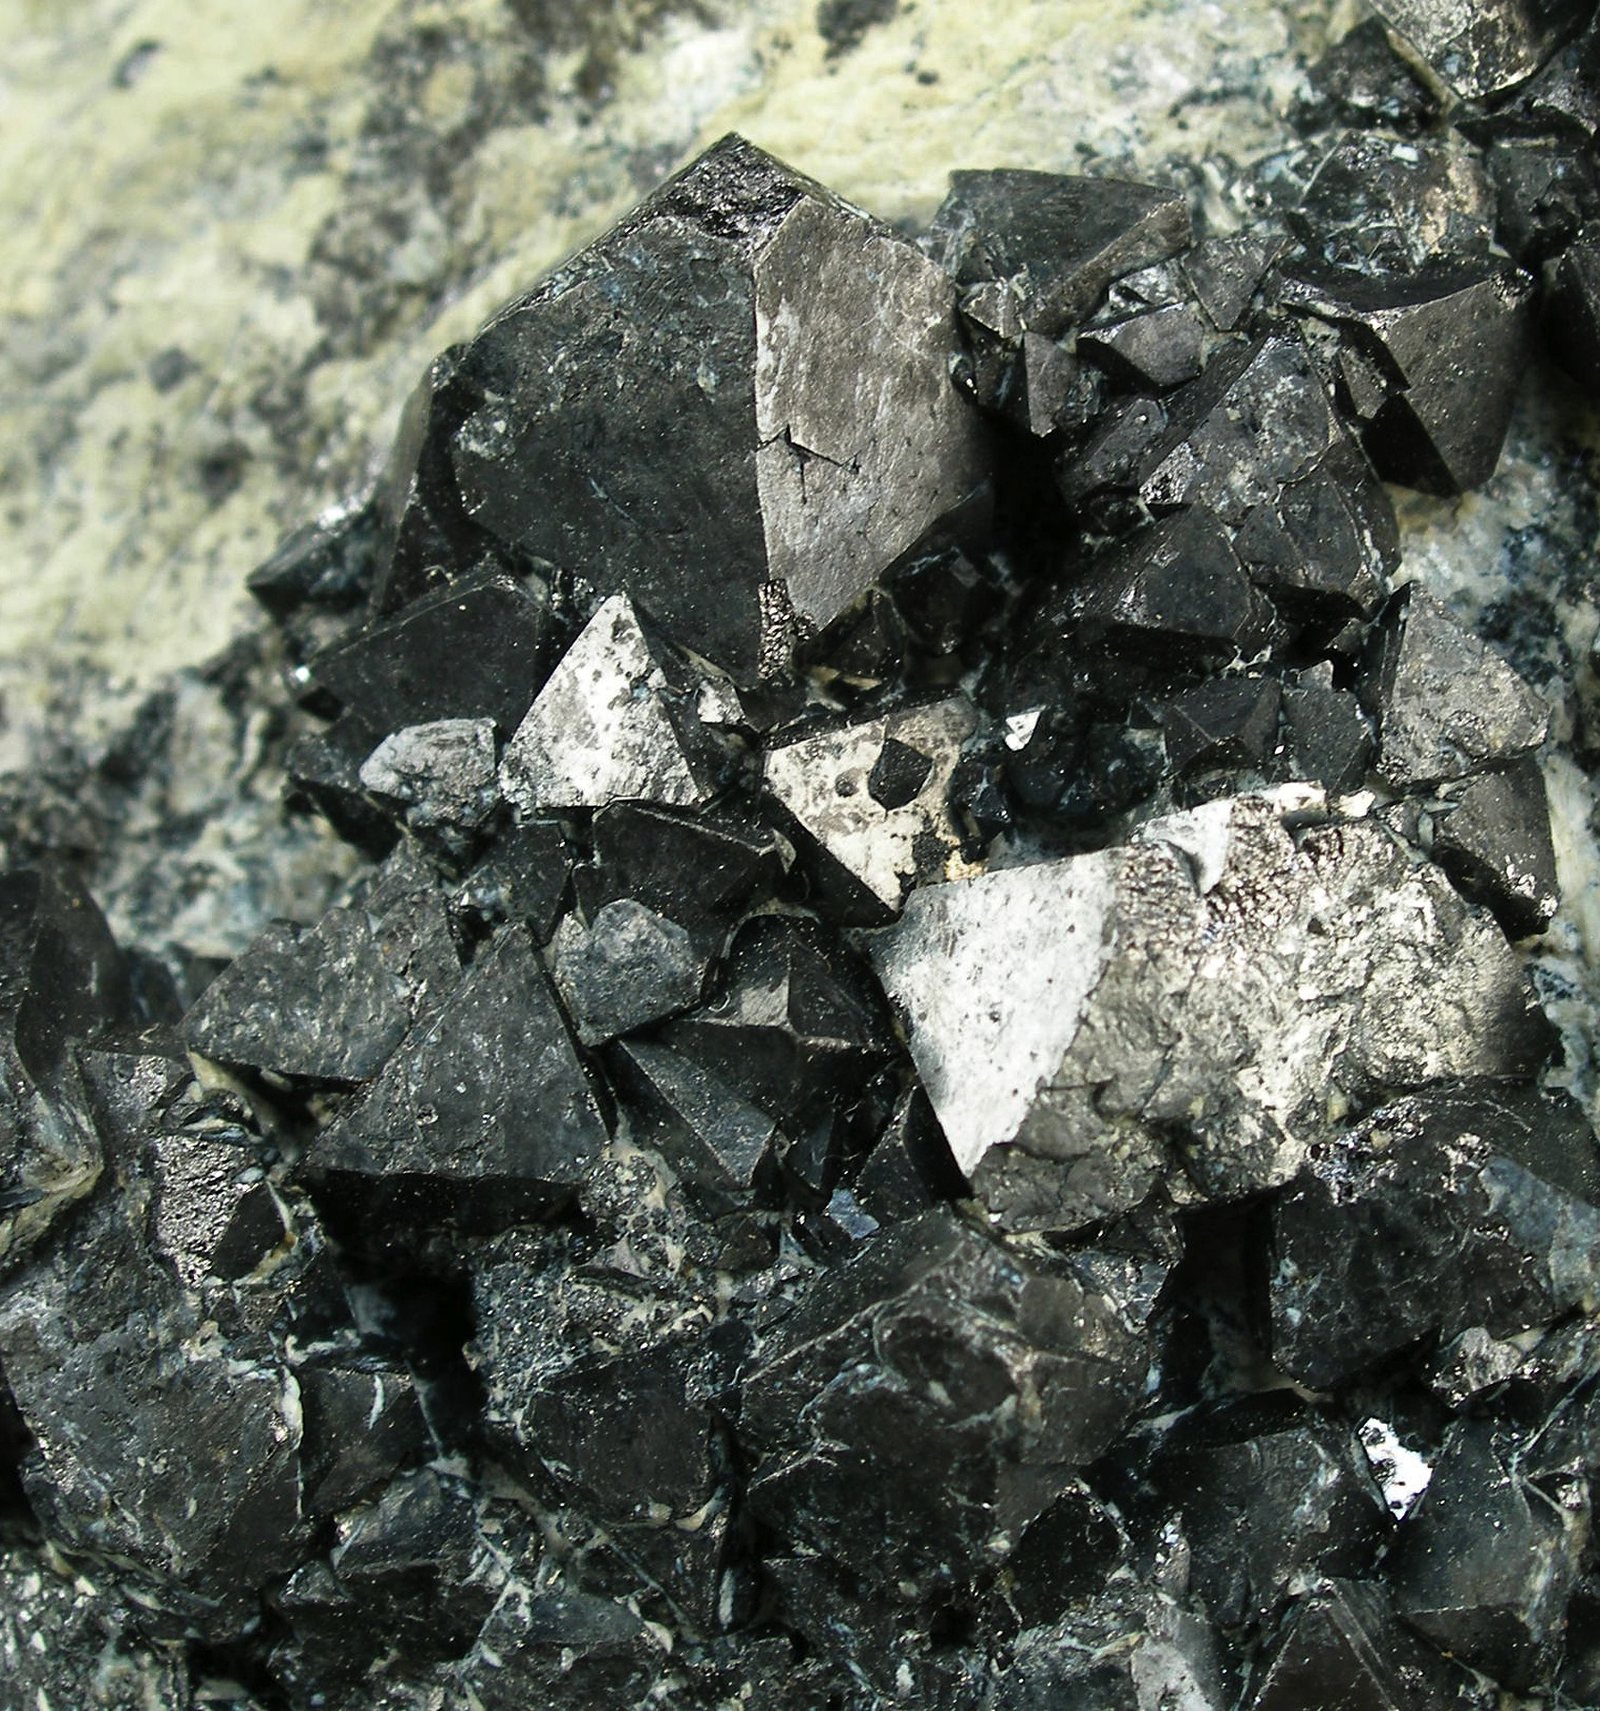
Magnetite
72% iron when pure but usually low grade in the ground; it is upgraded by magnetic separation into high-purity pellet…
生产主体
在地图上查看 →Mine production: Iron content
Mine production: Iron contentthousand metric tons 2025 (估计值)
USGS Mineral Commodity Summaries 2026 · USGS iron-ore figures are usable ore (gross weight); a separate line gives iron content. Do not compare the two. · 来源 ↗
横向滚动表格以查看其余列。
| 国家/地区 | 产量 | 占全球份额 |
|---|---|---|
| Australia | 600,000 | — |
| Brazil | 260,000 | — |
| India | 190,000 | — |
| China | 180,000 | — |
| Iran | 61,000 | — |
| Russia | 50,000 | — |
| South Africa | 42,000 | — |
| Canada | 41,000 | — |
| Other countries | 36,000 | — |
| Ukraine | 32,000 | — |
| United States | 24,000 | — |
| Sweden | 18,000 | — |
| Peru | 14,000 | — |
| Chile | 12,000 | — |
| Kazakhstan | 11,000 | — |
| Turkey | 11,000 | — |
| Mauritania | 9,300 | — |
| Mexico | 4,800 | — |
Mine production: Iron content, rounded
Mine production: Iron content, roundedthousand metric tons 2025 (估计值) 全球合计 1,600,000 thousand metric tons
USGS Mineral Commodity Summaries 2026 · USGS iron-ore figures are usable ore (gross weight); a separate line gives iron content. Do not compare the two. · 来源 ↗
横向滚动表格以查看其余列。
| 国家/地区 | 产量 | 占全球份额 |
|---|---|---|
| 全球合计 | 1,600,000 | 100% |
Mine production: Usable ore
Mine production: Usable orethousand metric tons 2025 (估计值)
USGS Mineral Commodity Summaries 2026 · USGS iron-ore figures are usable ore (gross weight); a separate line gives iron content. Do not compare the two. · 来源 ↗
横向滚动表格以查看其余列。
| 国家/地区 | 产量 | 占全球份额 |
|---|---|---|
| Australia | 980,000 | — |
| Brazil | 420,000 | — |
| India | 310,000 | — |
| China | 290,000 | — |
| Iran | 93,000 | — |
| Russia | 86,000 | — |
| Canada | 69,000 | — |
| South Africa | 66,000 | — |
| Other countries | 64,000 | — |
| Ukraine | 52,000 | — |
| United States | 38,000 | — |
| Kazakhstan | 35,000 | — |
| Sweden | 26,000 | — |
| Peru | 21,000 | — |
| Chile | 19,000 | — |
| Turkey | 18,000 | — |
| Mauritania | 15,000 | — |
| Mexico | 7,700 | — |
Mine production: Usable ore, rounded
Mine production: Usable ore, roundedthousand metric tons 2025 (估计值) 全球合计 2,600,000 thousand metric tons
USGS Mineral Commodity Summaries 2026 · USGS iron-ore figures are usable ore (gross weight); a separate line gives iron content. Do not compare the two. · 来源 ↗
横向滚动表格以查看其余列。
| 国家/地区 | 产量 | 占全球份额 |
|---|---|---|
| 全球合计 | 2,600,000 | 100% |
"未披露"表示美国地质调查局(USGS)为避免泄露单个企业数据而对该数字进行了保密处理——并不意味着数值为零。各国行数之和不一定等于世界合计,原因在于来源对每个数字单独进行四舍五入处理,且并不总是单独列出"其他国家/地区"一行。
储量持有方
Reserves (million metric tons): Crude ore
Reserves (million metric tons): Crude oremillion metric tons 2025
USGS Mineral Commodity Summaries 2026 · 来源 ↗
| 国家/地区 | 储量 | 占全球份额 |
|---|---|---|
| Australia | 59,000 | — |
| Russia | 35,000 | — |
| Brazil | 34,000 | — |
| China | 17,000 | — |
| Other countries | 11,000 | — |
| Mauritania | 10,000 | — |
| Ukraine | 6,500 | — |
| Canada | 6,000 | — |
| India | 5,500 | — |
| Iran | 4,200 | — |
| Kazakhstan | 3,800 | — |
| United States | 3,600 | — |
| Chile | 3,000 | — |
| Peru | 1,800 | — |
| Sweden | 1,300 | — |
| South Africa | 1,200 | — |
| Mexico | 940.0 | — |
| Turkey | 150.0 | — |
Reserves (million metric tons): Crude ore, rounded
Reserves (million metric tons): Crude ore, roundedmillion metric tons 2025
USGS Mineral Commodity Summaries 2026 · 来源 ↗
| 国家/地区 | 储量 | 占全球份额 |
|---|---|---|
| 全球合计 | 200,000 | 100% |
Reserves (million metric tons): Iron content
Reserves (million metric tons): Iron contentmillion metric tons 2025
USGS Mineral Commodity Summaries 2026 · 来源 ↗
| 国家/地区 | 储量 | 占全球份额 |
|---|---|---|
| Australia | 27,000 | — |
| Brazil | 15,000 | — |
| Russia | 14,000 | — |
| Other countries | 6,000 | — |
| Mauritania | 4,400 | — |
| India | 3,400 | — |
| China | 3,000 | — |
| United States | 2,700 | — |
| Ukraine | 2,300 | — |
| Canada | 2,300 | — |
| Iran | 1,500 | — |
| Kazakhstan | 1,500 | — |
| Peru | 1,000 | — |
| Chile | 740.0 | — |
| South Africa | 680.0 | — |
| Sweden | 600.0 | — |
| Mexico | 520.0 | — |
| Turkey | 99.00 | — |
Reserves (million metric tons): Iron content, rounded
Reserves (million metric tons): Iron content, roundedmillion metric tons 2025
USGS Mineral Commodity Summaries 2026 · 来源 ↗
| 国家/地区 | 储量 | 占全球份额 |
|---|---|---|
| 全球合计 | 87,000 | 100% |
价格
Iron ore, global price
年度平均值US$ per tonne
基准: IMF global price of iron ore — China import, 62% Fe fines, CFR Tianjin. 年度平均值,来源: FRED (IMF primary commodity prices) · 来源 ↗. 以下为参考年度均价,非实时市场报价。
average unit value reported by mines, dollars per metric ton
年度平均值dollars per metric ton
基准: average unit value reported by mines, dollars per metric ton. 年度平均值,来源: USGS Mineral Commodity Summaries 2026 · 来源 ↗. 以下为参考年度均价,非实时市场报价。
产出该材料的矿山
所有矿山 →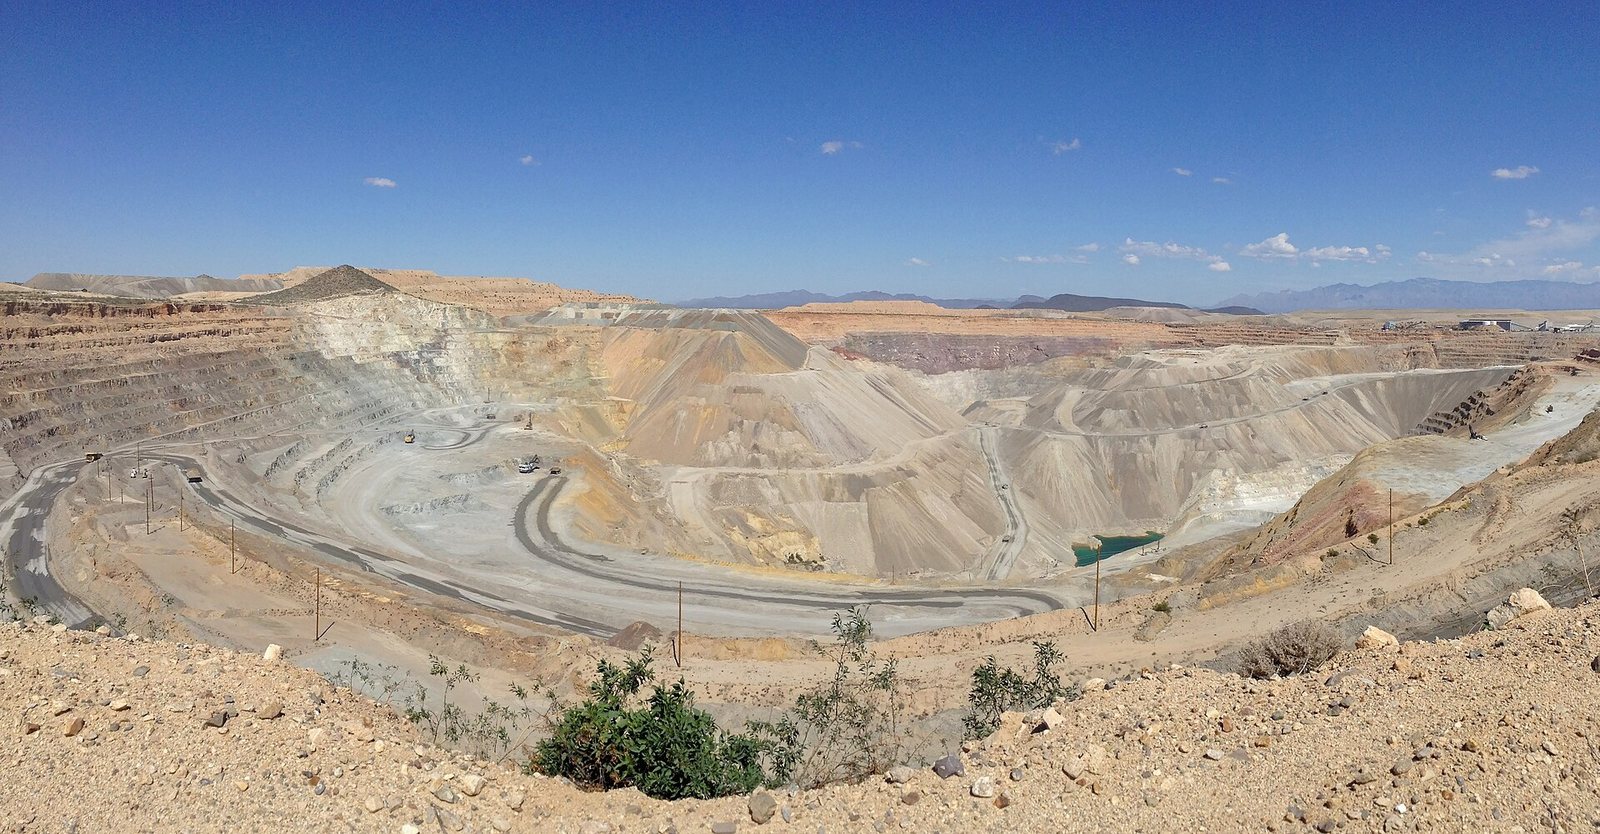
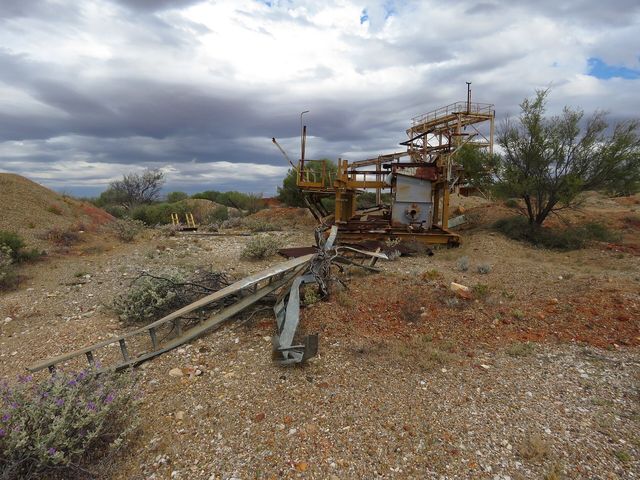
Pilbara Iron Ore District
The largest iron-ore export region in the world.
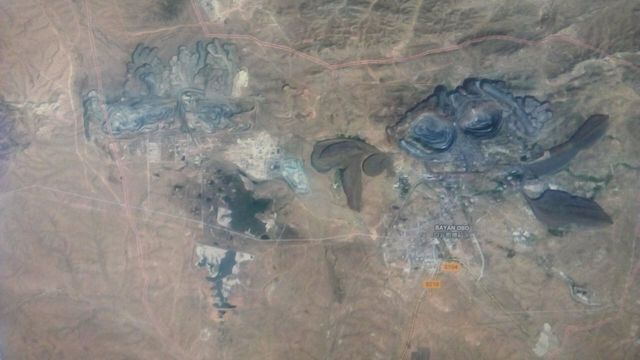
Bayan Obo
The largest rare-earth deposit in the world.
其加工与精炼地点
| 工厂 | 类型 | 阶段 | 国家/地区 | 角色 |
|---|---|---|---|---|
| Chinese NdFeB Magnet Cluster | 磁体工厂 | 组件 | China | 输入 |
| Port Hedland | 港口 | 加工 | Australia | 输入 |
| Port of Rotterdam Bulk Terminals | 港口 | 加工 | Netherlands | 输入 |
其用途
所有终端市场 →| 终端市场 | 其在彼处的用途 | 重要性 |
|---|---|---|
| Construction & Steel | Steel | 定义 |
| Grid Storage | Iron-air and iron-based chemistries | 重要 |
某项技术的需求用量
| 技术 | 数量 | 报价 | 基准 |
|---|---|---|---|
| LFP Lithium-Ion Battery | 25.00–45.00 kg | per 75 kWh pack | Iron in the cathode |
| NdFeB Permanent Magnet | 0.6–0.7 kg | per kg of finished magnet | Iron balance of the alloy |
Indicative range compiled from published technology studies and chemistry; verify against a manufacturer specification before use. 在物料计算器中按任意规模运行这些数据 →
出口管制
| 国家/地区 | 管控 | 适用于 |
|---|---|---|
| Laos | Export ban | Raw minerals, including copper, gold, iron, nickel, potassium, silver, and zinc (2024). ↗ |
| Vietnam | Export ban | Raw materials of iron, lead-zinc, chromite, manganese, apatite, and rare earths and deeply processed titanium (2012). ↗ |
USGS Mineral Commodity Summaries 2026, table 4 — controls in effect as of January 2026, excluding controls since lifted.
跟踪其跨境全程
全部溯源记录 →这批材料实际经过的路线——每个国家、每位托管方,以及每个环节留下的内容。
Pilbara iron ore to Chinese steel The largest material flow on Earth: dig it, crush it, screen it, and put it on a boat.