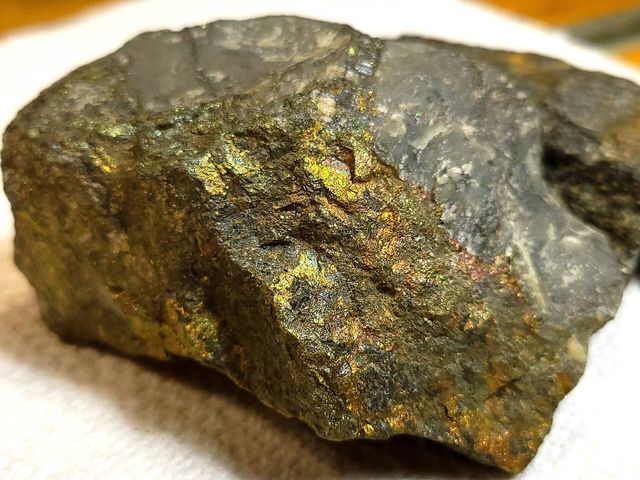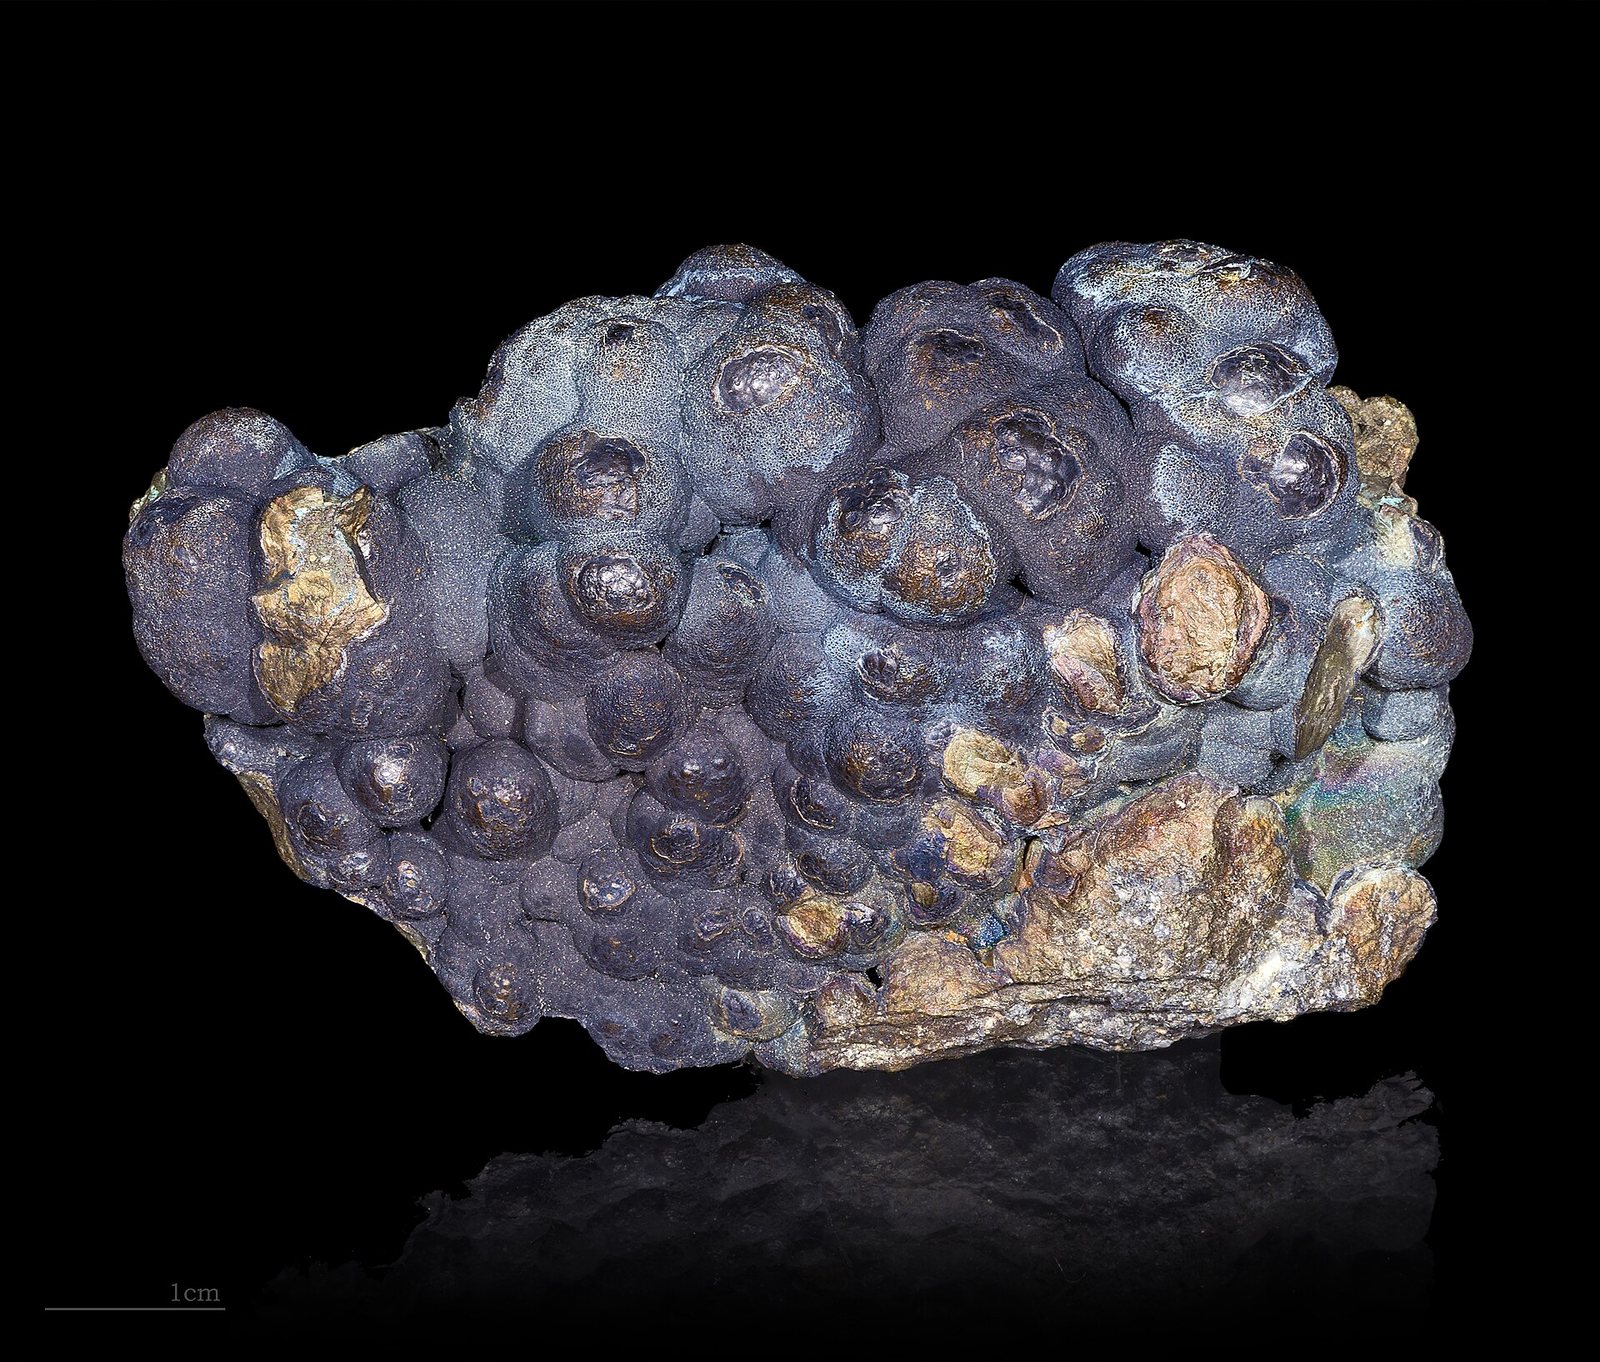
Qu'est-ce que c'est ?
The reddish metal that carries electricity better than anything except silver, and which humans have been smelting for about 7,000 years.
Pourquoi est-ce important ?
Every kilowatt-hour generated has to travel down copper. Grids, motors, data centres, buildings and vehicles all compete for the same refined metal.
Where it is in the Earth
Where it is in the Earth
Copper is one of the more abundant metals in the Earth's crust, but it is almost never concentrated enough to mine in its natural, dispersed state. What makes a copper deposit is a geological process that gathered the metal from large volumes of rock and deposited it in a much smaller volume over millions of years. The most important of these processes produces what geologists call a porphyry copper deposit. The word porphyry describes a type of igneous rock — rock that solidified from magma — in which large crystals are set inside a finer-grained mass. When magma rises towards the surface and begins to cool, water and other hot fluids are expelled. Those fluids scavenge copper from the surrounding rock, travel along fractures, and eventually deposit sulfide minerals — principally chalcopyrite, a compound of copper, iron and sulfur — as conditions change. The result is a very large, low-grade body of mineralised rock. Porphyry deposits account for the great majority of the world's mined copper, and they explain why Chile, Peru and parts of the American Southwest — all sitting on or near the ancient collision zone where the Pacific oceanic plate has driven under the South American and North American continents — hold so much of the world's reserves.
A second important deposit type is the sediment-hosted stratiform deposit, where copper minerals were laid down in ancient sedimentary basins, probably by metal-bearing brines circulating through porous rock. The Congolese Copperbelt and the Zambian Copperbelt formed this way, and they tend to carry higher grades than porphyries, with a different mix of ore minerals including bornite and chalcocite alongside chalcopyrite. A third type, found at Norilsk in Russia and Sudbury in Canada, is the magmatic sulfide deposit, formed when copper, nickel and other metals separated from a cooling magma body and settled together. These are typically mined as much for nickel or platinum-group metals as for copper itself. The common thread in all cases is that geological time and energy — heat, pressure, fluid movement — did the work of concentration that makes mining economically feasible.
Near the surface, many copper sulfide deposits are chemically altered by weathering. Rainwater carrying oxygen and weak acids reacts with sulfide minerals, dissolves the copper, and redeposits it lower in the profile as very high-grade secondary minerals — chalcocite and bornite in the sulfide zone, and carbonates such as malachite in the oxide zone above the water table. This process is called supergene enrichment, and it explains why some deposits have a rich cap of oxide ore sitting above a lower-grade primary sulfide body. The oxide and sulfide portions require different processing routes, which has practical consequences at the mine.
Getting it out
Getting it out
Because porphyry copper deposits are very large and typically low-grade — ore grades of roughly 0.3 to 1 percent copper are normal — they are almost always mined by open pit methods. Open pit mining involves removing rock from a progressively deepening pit, blasting it loose in benches, and loading it onto trucks or conveyors. The defining feature of this approach is the sheer volume of waste. For every tonne of ore that carries copper, several tonnes of waste rock — material too lean to process — must be moved and stored somewhere. The ratio of waste to ore, called the strip ratio, varies by deposit but is often substantial; as a pit deepens over decades, the strip ratio tends to rise, increasing energy and haulage costs per tonne of copper recovered. Open pit mines are among the largest human-made structures on Earth for exactly this reason.
Underground mining becomes the preferred option when the orebody is deep, when the surface topography makes an open pit impractical, or when the ore is high-grade enough to justify the greater cost of driving tunnels and shafts. El Teniente in Chile, the world's largest underground copper mine, uses a technique called block caving: miners undercut a large block of rock, which then collapses under its own weight and is drawn off through tunnels below. Block caving can move very large tonnages at relatively low cost per tonne once established, but it requires long lead times to prepare and cannot be easily accelerated. Some deposits, like Oyu Tolgoi in Mongolia, use both open pit and underground methods at different stages of their life.
A distinct extraction route applies to oxide copper ores. Rather than crushing and concentrating the rock, operators heap it onto lined pads and irrigate it with dilute sulfuric acid. The acid dissolves the copper out of the rock, and the resulting copper-rich solution is then processed through a two-stage electrochemical system — solvent extraction followed by electrowinning, universally abbreviated SX-EW — to produce copper cathode directly, without passing through a smelter. This route is well suited to arid regions where water is scarce, since the acid solution is largely recycled, and it avoids the sulfur dioxide emissions associated with smelting sulfide ores. Morenci in Arizona is a large example. However, SX-EW cathode cannot easily carry the by-product credits — gold, silver, molybdenum — that make sulfide concentrate economics attractive, because those metals do not dissolve in the acid leach.
What pulls on it
What pulls on it
Copper is bought primarily because it conducts electricity. Its electrical conductivity is exceeded only by silver, which is far scarcer and more expensive, so copper has been the default conductor in almost every electrical application for well over a century. Construction — the wiring inside buildings — has historically been the largest single end-use, and it remains very large. Industrial machinery, power generation and transmission, and transport have always competed alongside it. None of these uses are going away; replacing the wiring in existing buildings alone represents a continuing, replacement-driven demand that is largely independent of economic cycles.
What has changed the shape of demand in recent years is the scale of electrification underway in energy and transport. The material-intensity figures in the database illustrate the point concretely: a direct-drive offshore wind turbine requires between 3,000 and 8,000 kilograms of copper per megawatt of capacity, a photovoltaic solar installation between 2,000 and 4,000 kilograms per megawatt, and a pressurised water reactor between 1,000 and 2,000 tonnes per gigawatt. Electric vehicles carry copper in their motor windings, battery current collectors, busbars and charging infrastructure. Data centres, whose power consumption has risen sharply with the expansion of computing capacity for artificial intelligence workloads, require dense copper wiring in busbars, power distribution and network cables. All of these are applications where growth in the installed base translates directly into demand for new copper, not merely replacement copper.
For demand to change sharply in a downward direction, one of a small number of things would have to be true: a viable, affordable substitute would have to emerge at scale in one or more of the high-volume applications; electrification programmes would have to slow or reverse; or economic growth in the regions that build and wire the most infrastructure would have to stall for an extended period. For demand to exceed what current supply capacity can deliver, the current pace of energy transition and data-infrastructure build-out would need to be sustained while new mine supply takes the time it typically requires to come online.
Turning ore into product Niveau 3
Turning ore into product
Sulfide copper ore leaves the mine as run-of-mine rock averaging less than one percent copper. The first task is comminution — reducing particle size through crushing and then grinding in large rotating mills, typically using steel balls or rods as the grinding medium. The purpose is to liberate chalcopyrite grains from the surrounding waste minerals so they can be separated. Liberation requires grinding to a fine particle size, which is energy-intensive; comminution is usually the largest single energy cost at a copper concentrator. Once ground, the slurry passes through froth flotation, a process that exploits the surface chemistry of sulfide minerals: reagents are added that make chalcopyrite particles hydrophobic, air is bubbled through the tank, and the copper minerals attach to bubbles and float to the surface as a froth while the gangue — waste rock — sinks. The resulting concentrate typically carries around 25 to 30 percent copper, as noted in the traded forms recorded in the database, along with iron sulfide, silica and the precious metal by-products. Overall recovery from ore to concentrate is imperfect; fine particles and locked grains are lost to the tailings stream, and this is where most of the copper that enters the mill but never reaches the smelter is lost.
Concentrate is shipped, usually as a damp solid, to a smelter. In the smelter, the concentrate is heated in a furnace where iron sulfide and silica are oxidised and removed as slag, leaving a matte — a molten mixture of copper and sulfide — carrying around 60 to 70 percent copper. The matte is then blown with air or oxygen in a converter, which oxidises the remaining sulfur and iron to produce blister copper at roughly 98 to 99 percent purity. The sulfur dioxide driven off at this stage must be captured, and most modern smelters route it to a sulfuric acid plant; the acid is then sold or used on-site for oxide-ore leaching, which is one reason smelters and SX-EW operations sometimes co-exist in the same district. Blister copper is fire-refined to remove residual oxygen and then cast into anodes. In the final step, electrorefining, anodes are dissolved electrolytically and copper is plated onto starter sheets to produce 99.99 percent pure cathode. The electrolyte accumulates gold, silver, selenium and tellurium, which are recovered as anode slimes — a commercially important by-product stream. Losses and value accrue at every stage: smelter and refinery charges (called TC/RCs, treatment and refining charges) are negotiated between the mine and the smelter and represent the price of the processing service.
Where oxide ore is processed by SX-EW, the flowsheet is shorter but the product is the same finished cathode. The copper-bearing pregnant leach solution from the heap passes through an organic solvent that selectively strips the copper, concentrating it and leaving impurities behind; the loaded solvent is then stripped back into a clean electrolyte, which feeds the electrowinning cells where copper plates out on to stainless steel blanks. The cathode produced this way meets the same LME Grade A standard as electrorefined cathode, though it carries no precious metal by-products.
Substitution and recycling Niveau 3
Substitution and recycling
Aluminium is the only substitute that has been deployed at genuine scale. It has roughly 60 percent of copper's electrical conductivity per unit cross-section, which means a larger conductor diameter is needed to carry the same current; it also has quite different mechanical properties and requires different jointing techniques to avoid corrosion at connections. In overhead transmission lines and some building wire markets, aluminium has taken a significant share precisely because it is lighter and cheaper by weight, and the engineering trade-offs are manageable at the design stage. In motor windings and electronics, however, the combination of conductivity, ductility, solderability and thermal management that copper offers is difficult to replicate without accepting meaningful performance penalties or redesigning the component from the ground up. Optical fibre has displaced copper in long-distance data transmission, but the electrical power that drives the equipment at each end of those fibres still travels through copper. Superconductors, which carry current with no resistive loss at all, can replace copper in some specialist applications — certain MRI magnets, experimental motors — but they require cryogenic cooling that adds cost and complexity far beyond what is justified in general use.
Recycling is a structurally important part of the copper supply picture. Copper does not degrade when recycled; secondary copper produced by remelting scrap is chemically identical to primary copper. The industry distinguishes new scrap, which arises in fabrication — offcuts, turnings, rejected castings — and is typically recycled quickly within the production chain, from old scrap, which comes from end-of-life products. Old scrap recovery depends on collection infrastructure, the economics of sorting, and the design of the product being retired. Copper wiring from demolished buildings is generally collected because it has obvious value and is easy to identify. Copper in small electronics, or dispersed through composite components, is harder and more expensive to recover. The result is that recycling supplies a meaningful share of total refined copper output globally, but a portion of the copper in circulation is effectively lost to dilution in low-grade scrap streams, landfill, or applications — such as some agricultural uses of copper-based fungicides — where recovery is not practical. Increasing the recycled share further depends on product design choices made decades before the product reaches end of life, on collection systems that do not yet exist uniformly, and on the economics of sorting and re-refining mixed scrap streams.
Where the chain is fragile Niveau 4
Where the chain is fragile
The most straightforward structural risk in the copper supply chain is geographic concentration at the mining stage. The reserve and production figures in the database show that Chile alone holds 180,000 thousand metric tonnes of reserves — by far the largest national share — and accounts for a substantial portion of annual mine output. Peru is the second-ranked producer by output in the data. Both countries have experienced periods of social conflict, water-access disputes and regulatory change that have interrupted production or delayed project development. The Democratic Republic of the Congo, which the data show as the third-largest producing country by mine output and the holder of 80,000 thousand metric tonnes of reserves, carries a different risk profile: political instability, infrastructure deficits, and the fact that much of its copper output is co-produced with cobalt, whose own market dynamics can affect the incentive to expand copper capacity independently.
Processing concentration adds a second layer of fragility that is separate from the mining geography. China dominates global copper smelting and refining capacity, as the database's processing plant list and refinery production figures reflect. Concentrate mined in South America, Africa or elsewhere frequently travels to Chinese smelters before re-entering global trade as cathode. This means that disruptions to Chinese processing capacity, or to the policy environment governing concentrate imports and cathode exports, propagate through the entire supply chain regardless of where the ore was dug. The treatment and refining charge negotiation — TC/RCs — is one place where the tension between mine supply and smelter capacity becomes numerically visible to analysts, though those figures are not included in this dataset.
A further uncertainty that affects how published supply figures should be read is the distinction the database's unit-basis note makes explicit: mine production is reported as contained copper in concentrate, refinery production as finished cathode, and adding the two double-counts the metal that passes through both stages. Different agencies, company reports and trade publications handle this aggregation differently, and the same physical tonne can appear in more than one line of a national or global total depending on the reporting convention. Reserve figures carry their own uncertainty: they are estimated under the economic assumptions prevailing at the time of the resource assessment, and a change in the assumed copper price or in processing costs can move the reserve boundary without any new drilling. Long project lead times — the interval between a discovery decision and first production at a new mine is typically measured in years to decades — mean that reserve and resource figures reflect optionality rather than near-term supply availability, and that the response of mine supply to a shift in demand is inherently delayed.
D'où cela vient dans la roche
Tous les minéraux de minerai →Ce sont les minéraux qui portent réellement copper. Un gisement n'est un corps minéralisé que si l'un d'eux est suffisamment concentré pour rentabiliser son extraction.
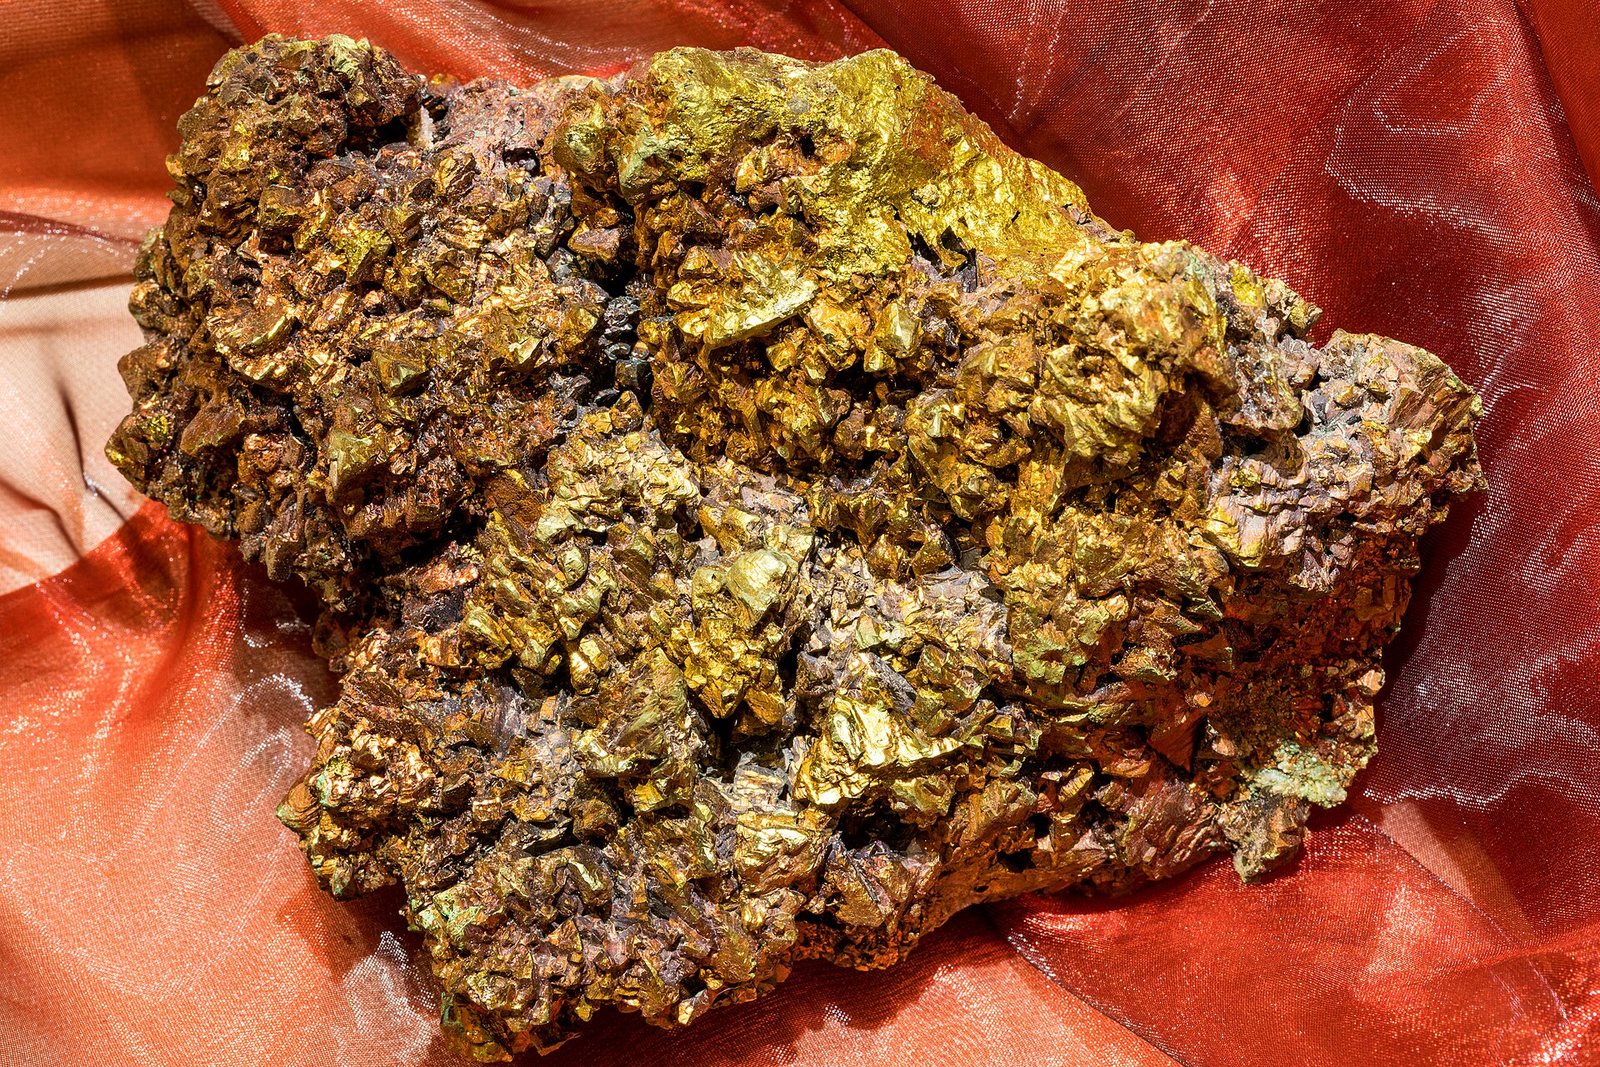
Chalcopyrite
The most important copper ore mineral on Earth. About 34% copper by weight when pure; typical ore grades are under 1%.
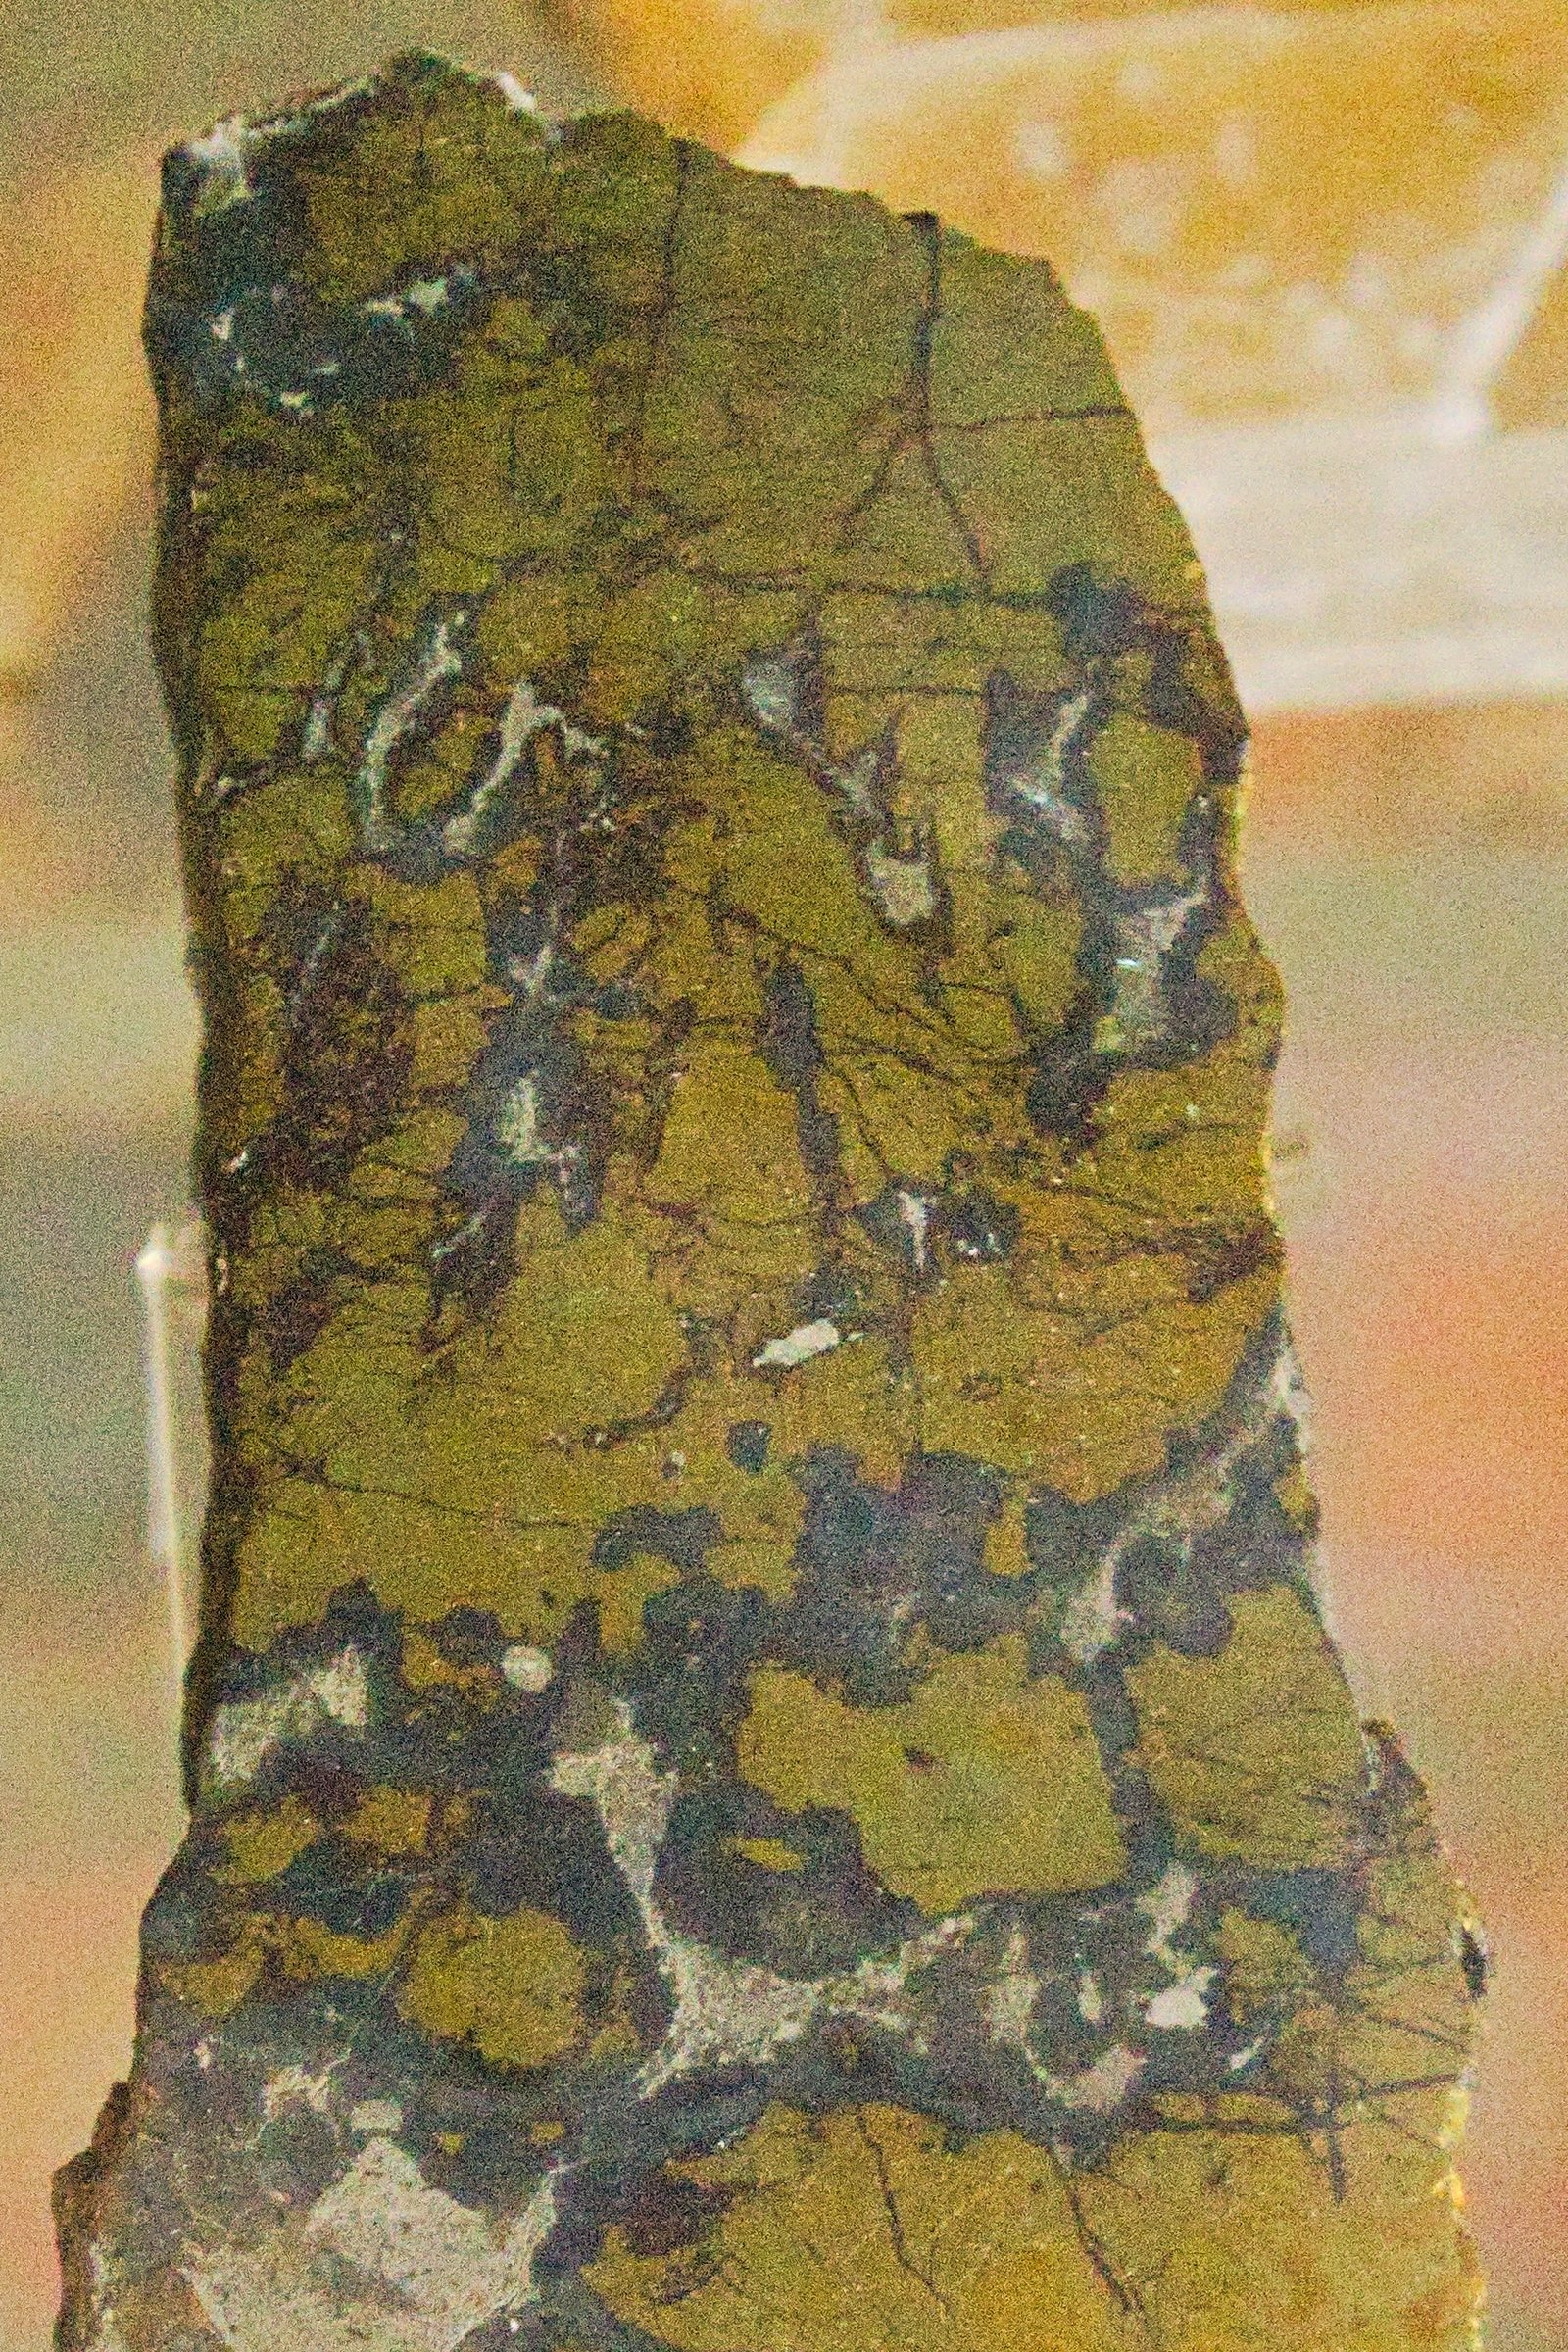
Bornite
A richer copper sulfide than chalcopyrite at about 63% Cu, common in the upper enriched zones of porphyry deposits.
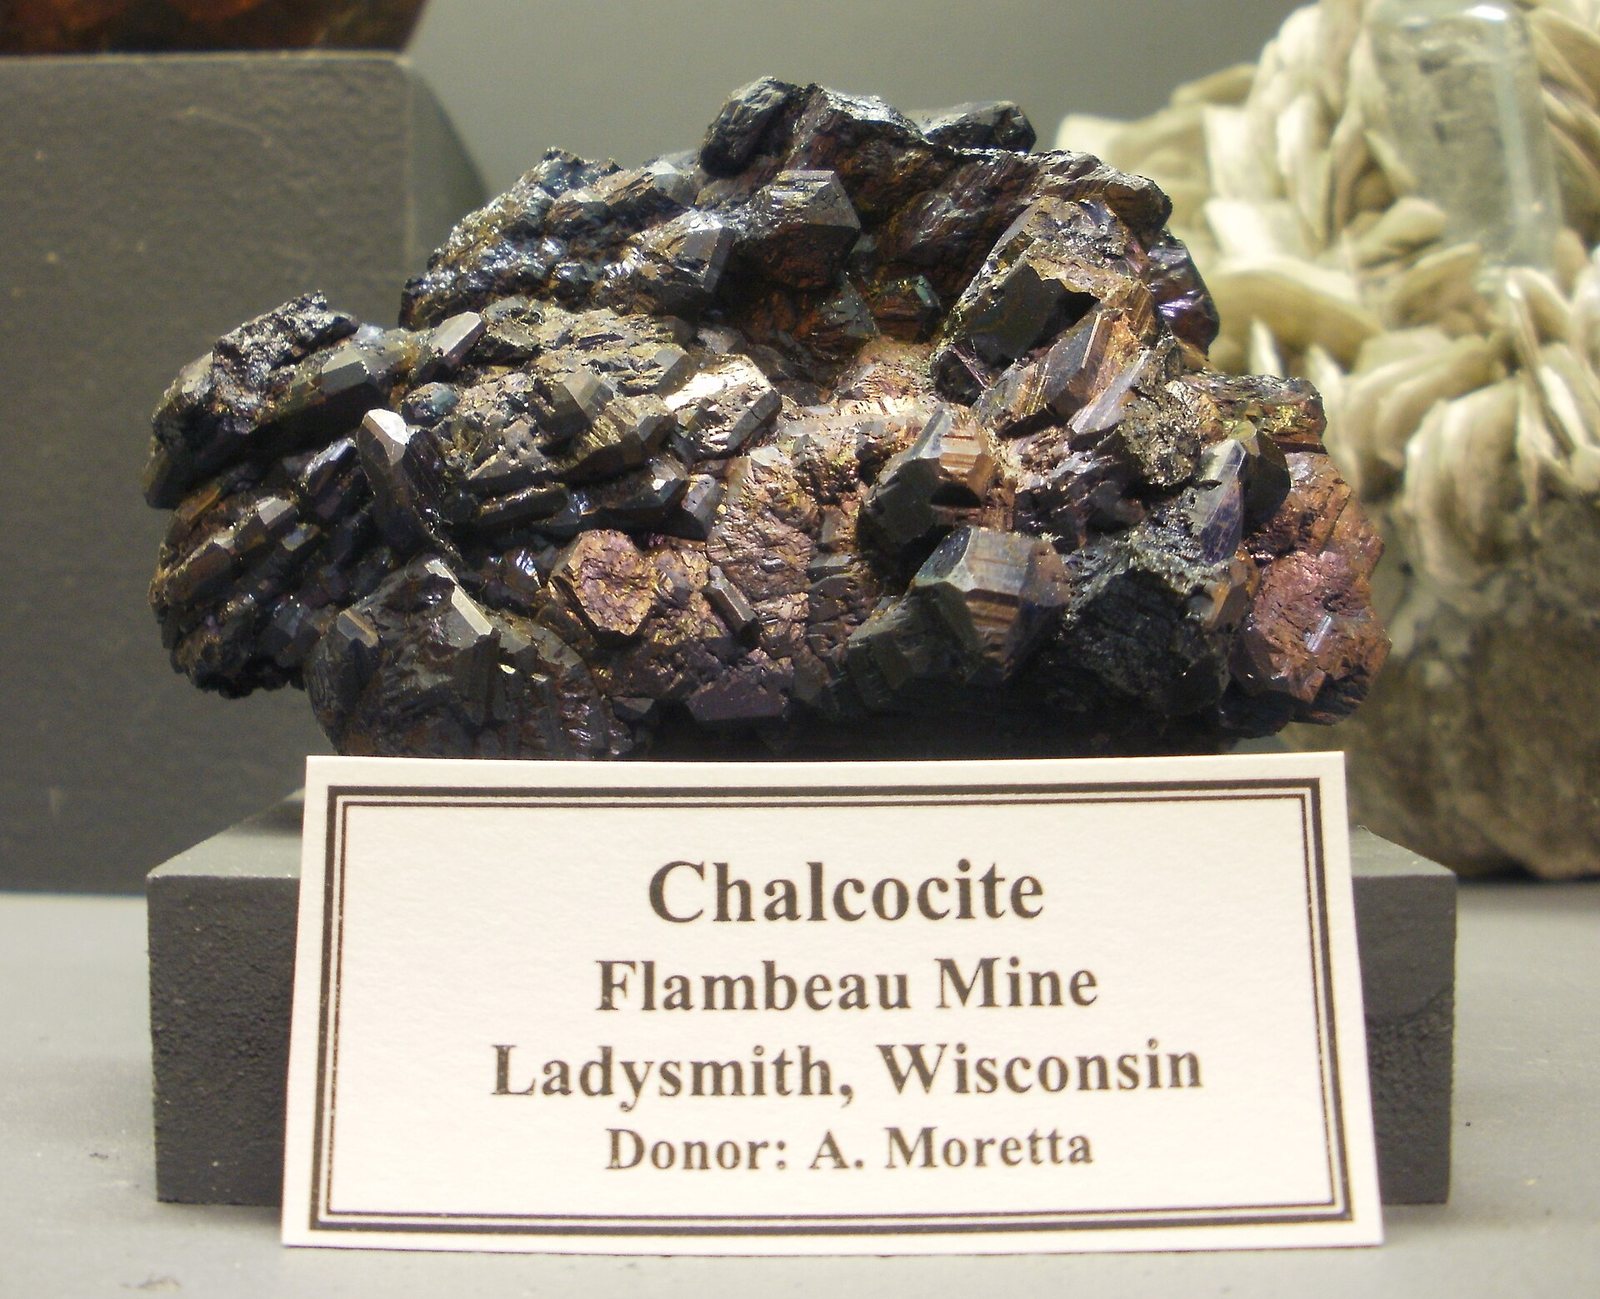
Chalcocite
The richest common copper sulfide, near 80% Cu, formed where weathering has redeposited copper below the water table.
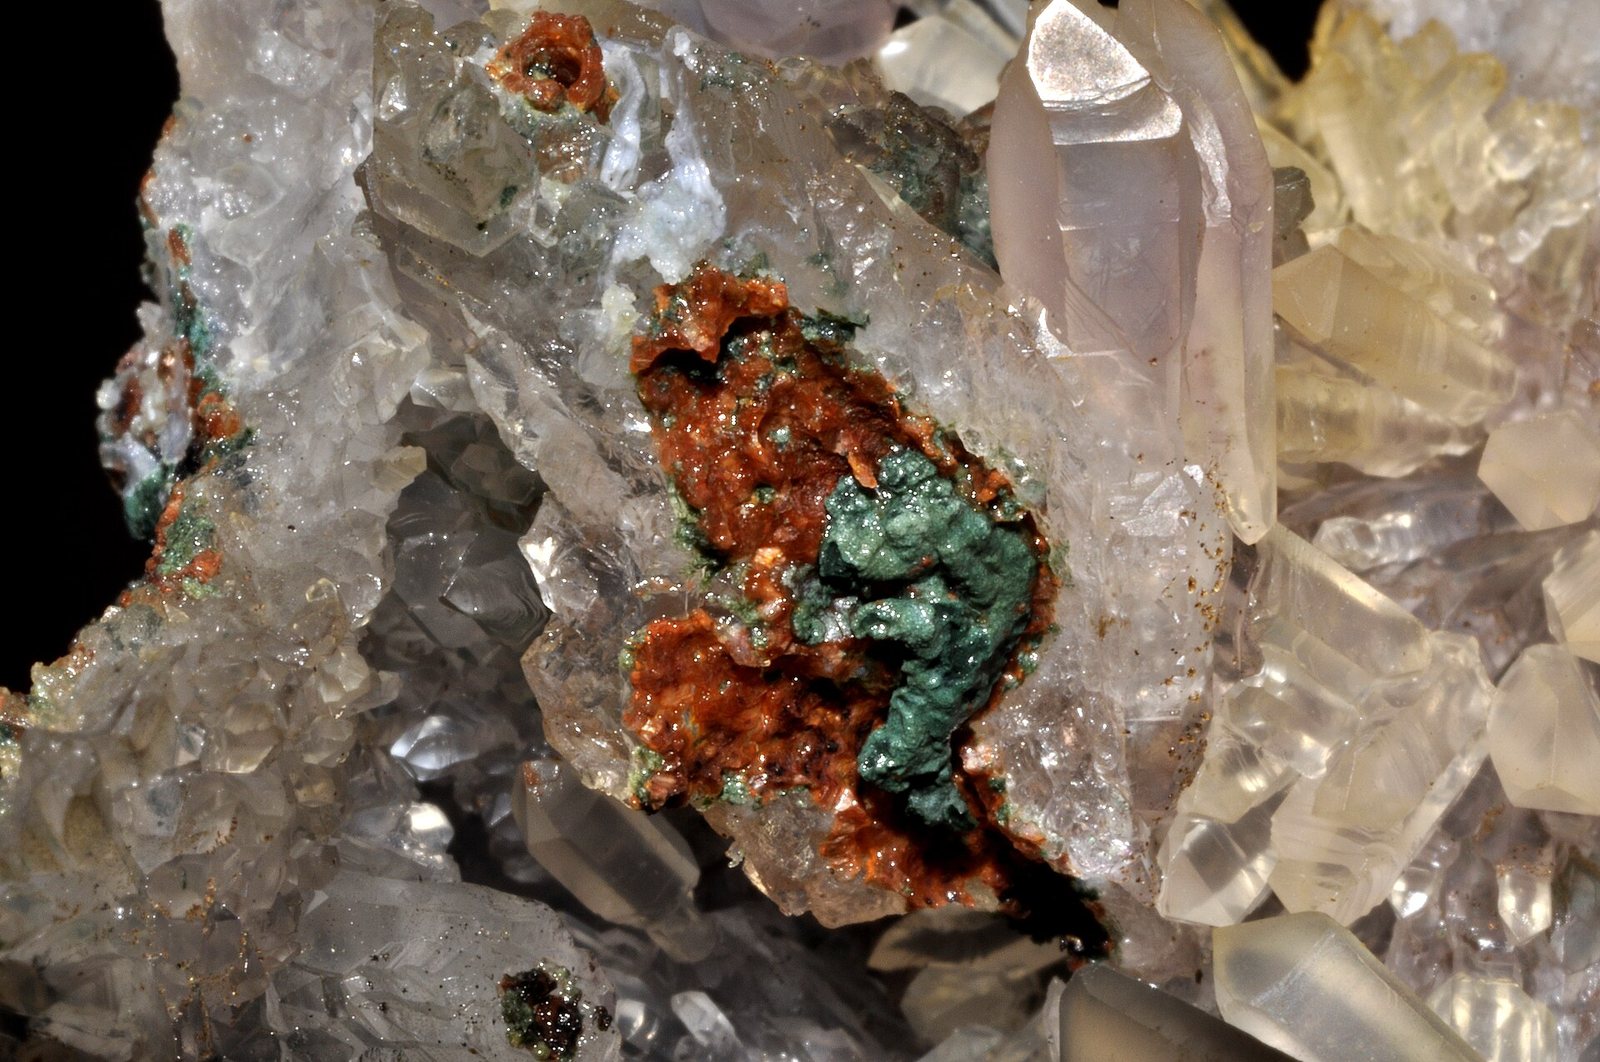
Malachite
An oxidised copper mineral. Leachable with acid without smelting, which is why oxide caps are mined first.
Qui le produit
Voir sur une carte →Mine production
Mine productionthousand metric tons 2025 (estimé) Total mondial 23,000 thousand metric tons
USGS Mineral Commodity Summaries 2026 · Mine production is contained copper in concentrate or cathode; refinery production is finished cathode. Adding the two double-counts. · source ↗
Faire défiler le tableau latéralement pour afficher les colonnes restantes.
| Pays | Production | Part mondiale |
|---|---|---|
| Chile | 5,300 | 23.0% |
| Congo (Kinshasa) | 3,200 | 13.9% |
| Other countries | 3,000 | 13.0% |
| Peru | 2,700 | 11.7% |
| China | 1,800 | 7.8% |
| Russia | 1,300 | 5.7% |
| United States | 1,000 | 4.3% |
| Zambia | 940.0 | 4.1% |
| Australia | 730.0 | 3.2% |
| Kazakhstan | 710.0 | 3.1% |
| Indonesia | 710.0 | 3.1% |
| Mexico | 690.0 | 3.0% |
| Canada | 500.0 | 2.2% |
| Poland | 410.0 | 1.8% |
| India | 23.00 | 0.1% |
| Korea, Republic of | Zero | — |
| Germany | Zero | — |
| Japan | Zero | — |
| Total mondial | 23,000 | 100% |
Refinery production
Refinery productionthousand metric tons 2025 (estimé) Total mondial 29,000 thousand metric tons
USGS Mineral Commodity Summaries 2026 · Mine production is contained copper in concentrate or cathode; refinery production is finished cathode. Adding the two double-counts. · source ↗
Faire défiler le tableau latéralement pour afficher les colonnes restantes.
| Pays | Production | Part mondiale |
|---|---|---|
| China | 14,000 | 48.3% |
| Congo (Kinshasa) | 2,800 | 9.7% |
| Other countries | 2,100 | 7.2% |
| Chile | 1,700 | 5.9% |
| Japan | 1,400 | 4.8% |
| Russia | 950.0 | 3.3% |
| United States | 850.0 | 2.9% |
| India | 620.0 | 2.1% |
| Korea, Republic of | 610.0 | 2.1% |
| Germany | 610.0 | 2.1% |
| Poland | 560.0 | 1.9% |
| Kazakhstan | 500.0 | 1.7% |
| Mexico | 480.0 | 1.7% |
| Australia | 460.0 | 1.6% |
| Indonesia | 400.0 | 1.4% |
| Peru | 340.0 | 1.2% |
| Canada | 320.0 | 1.1% |
| Zambia | 270.0 | 0.9% |
| Total mondial | 29,000 | 100% |
« Withheld » signifie que l'USGS a supprimé le chiffre afin de ne pas divulguer les données d'une entreprise individuelle — cela ne signifie pas zéro. La somme des lignes par pays ne correspond pas toujours au total mondial, car la source arrondit chaque chiffre de manière indépendante et ne détaille pas toujours une ligne « autres pays ».
Qui détient les réserves
Reserves
Reservesthousand metric tons 2025
USGS Mineral Commodity Summaries 2026 · source ↗
| Pays | Réserves | Part mondiale |
|---|---|---|
| Other countries | 210,000 | 21.4% |
| Chile | 180,000 | 18.4% |
| Australia | 100,000 | 10.2% |
| Peru | 85,000 | 8.7% |
| Russia | 80,000 | 8.2% |
| Congo (Kinshasa) | 80,000 | 8.2% |
| Mexico | 53,000 | 5.4% |
| United States | 47,000 | 4.8% |
| China | 41,000 | 4.2% |
| Poland | 33,000 | 3.4% |
| Indonesia | 21,000 | 2.1% |
| Zambia | 21,000 | 2.1% |
| Kazakhstan | 20,000 | 2.0% |
| Canada | 7,000 | 0.7% |
| India | 2,200 | 0.2% |
| Japan | Zero | — |
| Germany | Zero | — |
| Korea, Republic of | Zero | — |
| Total mondial | 980,000 | 100% |
Prix
Copper, global price
Moyenne annuelleUS$ per tonne
Base: IMF global price of copper — grade A cathode, LME/COMEX/NYMEX average. Moyennes annuelles telles que publiées dans FRED (IMF primary commodity prices) · source ↗. Il s'agit de moyennes annuelles de référence, et non de cotations de marché en temps réel.
annual average, cents per pound: COMEX, high-grade, first position
Moyenne annuellecents per pound
Base: annual average, cents per pound: COMEX, high-grade, first position. Moyennes annuelles telles que publiées dans USGS Mineral Commodity Summaries 2026 · source ↗. Il s'agit de moyennes annuelles de référence, et non de cotations de marché en temps réel.
annual average, cents per pound: U.S. producer, cathode (COMEX + premium)
Moyenne annuellecents per pound
Base: annual average, cents per pound: U.S. producer, cathode (COMEX + premium). Moyennes annuelles telles que publiées dans USGS Mineral Commodity Summaries 2026 · source ↗. Il s'agit de moyennes annuelles de référence, et non de cotations de marché en temps réel.
annual average, cents per pound: London Metal Exchange, grade A, cash
Moyenne annuellecents per pound
Base: annual average, cents per pound: London Metal Exchange, grade A, cash. Moyennes annuelles telles que publiées dans USGS Mineral Commodity Summaries 2026 · source ↗. Il s'agit de moyennes annuelles de référence, et non de cotations de marché en temps réel.
Mines qui le produisent
Toutes les mines →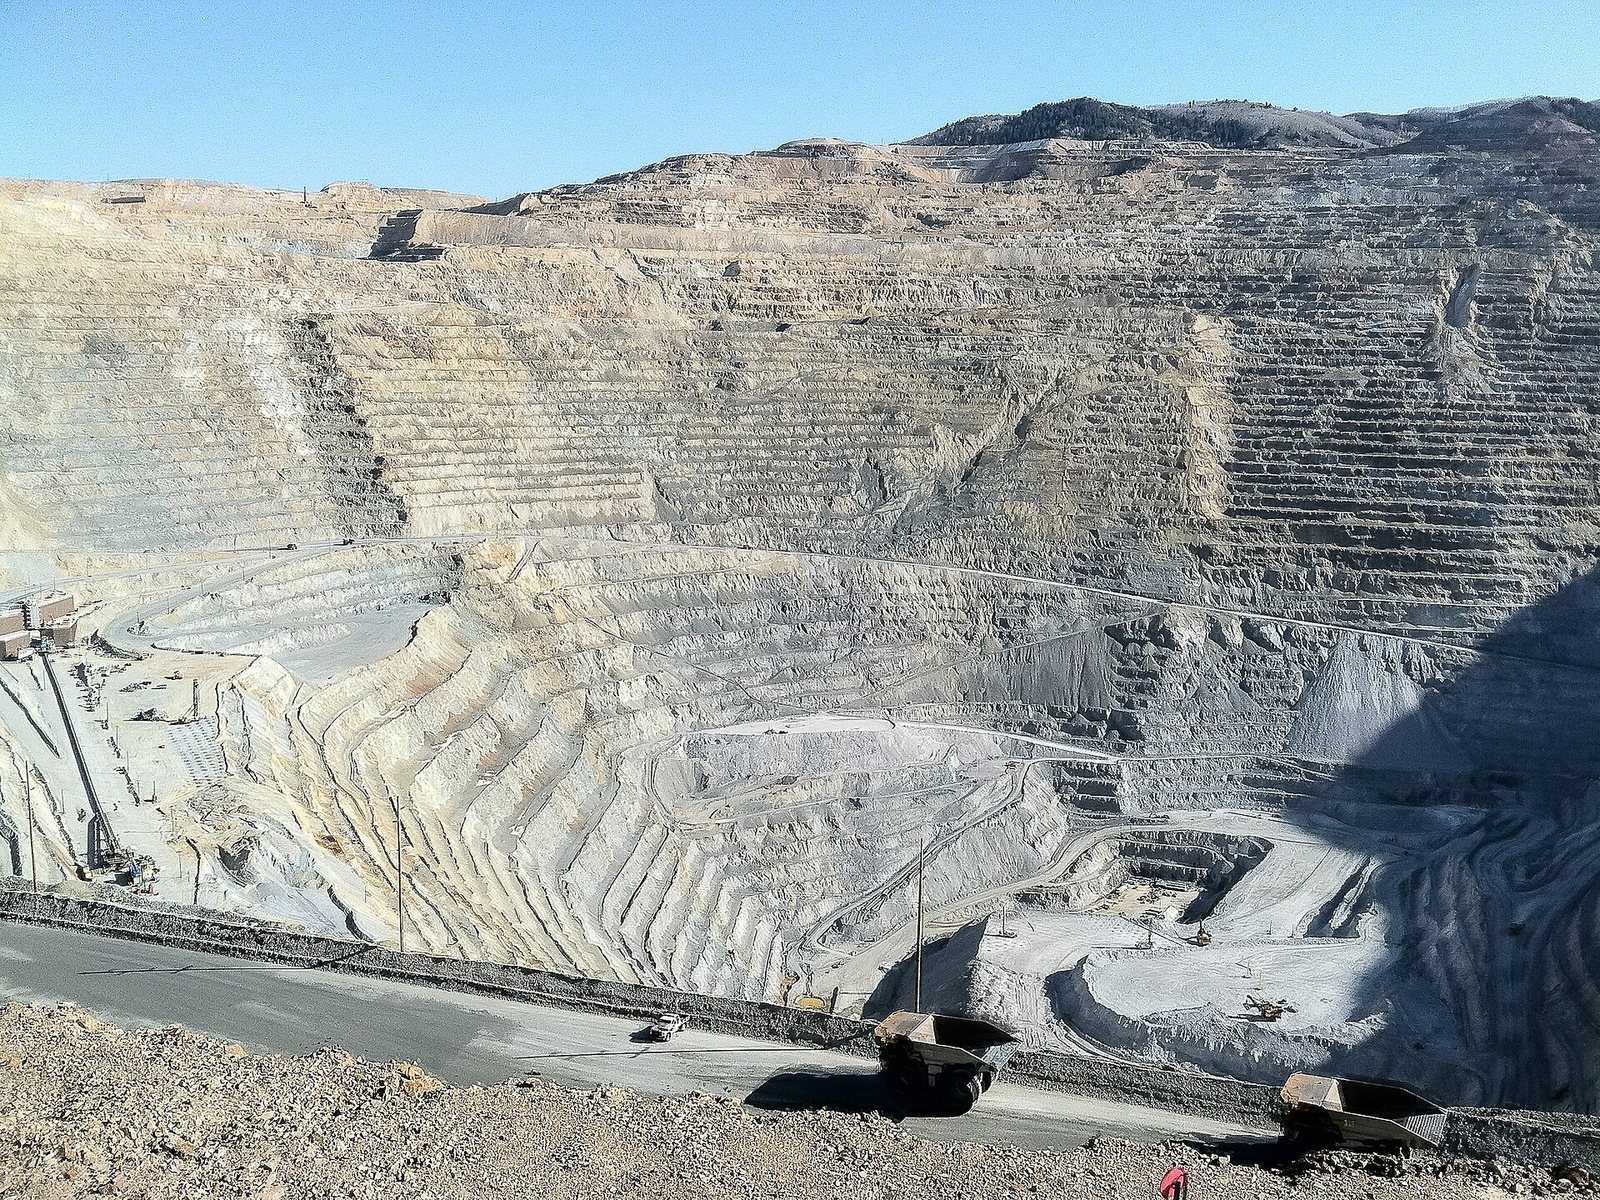
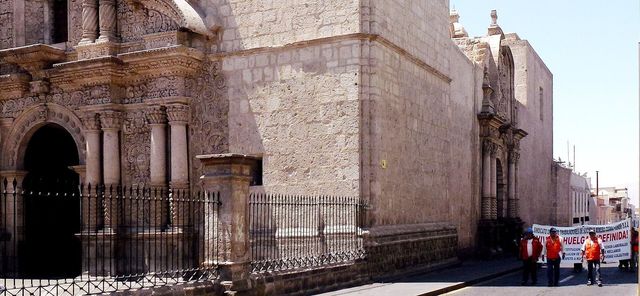
Cerro Verde
One of the largest concentrator complexes in the world by throughput.
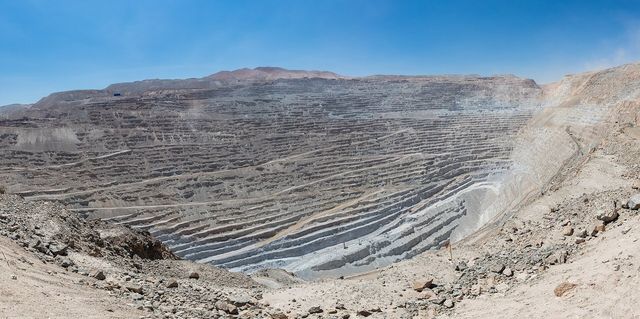
Chuquicamata
Historically the largest open-pit copper mine in the world by excavated volume.
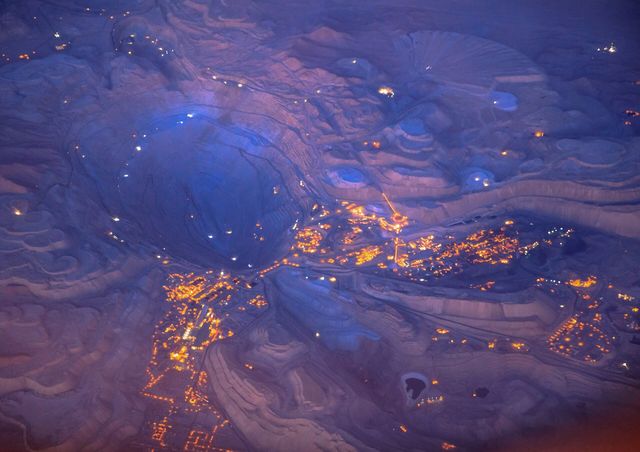
Collahuasi
Among the largest copper mines by output.
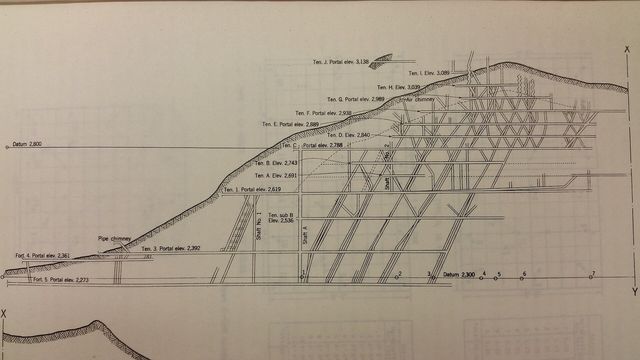
El Teniente
The largest underground copper mine in the world by excavated extent.
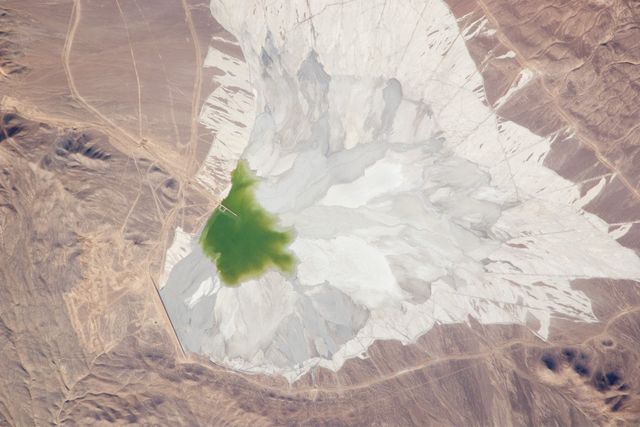
Escondida
Consistently the largest copper mine in the world by output.
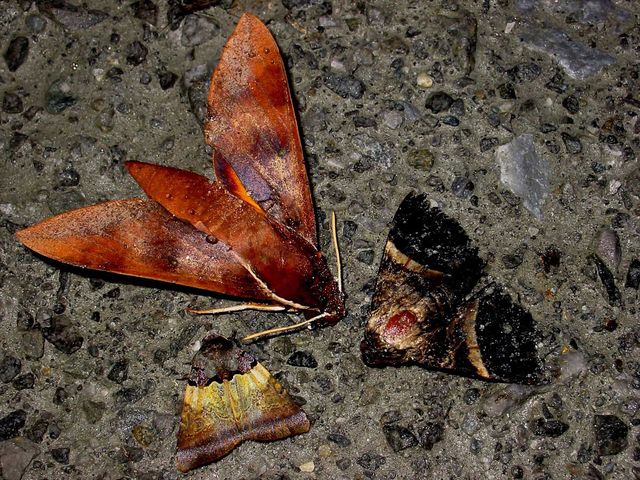
Grasberg
One of the largest copper deposits and among the largest gold deposits ever mined.
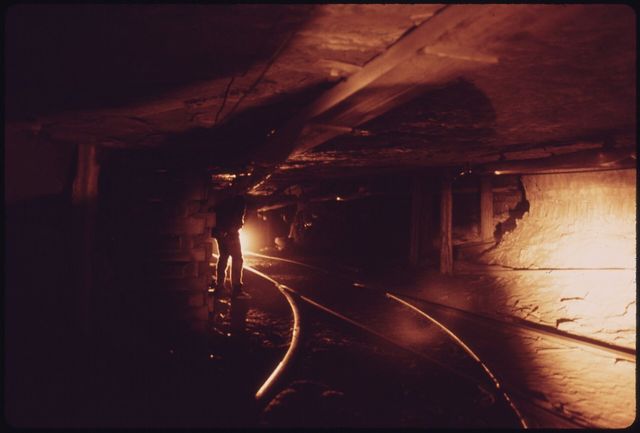
Kamoa-Kakula
One of the highest-grade large copper deposits discovered in decades.
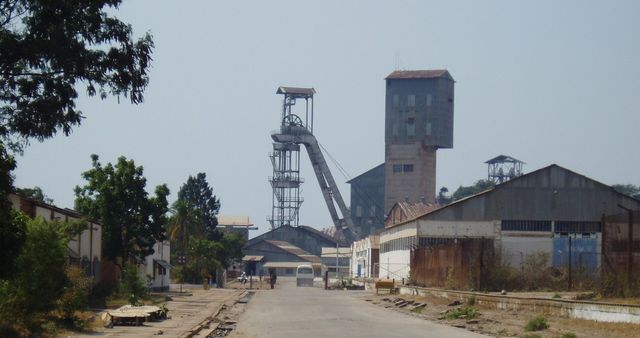
Kamoto (KCC)
Among the world's largest cobalt producers.
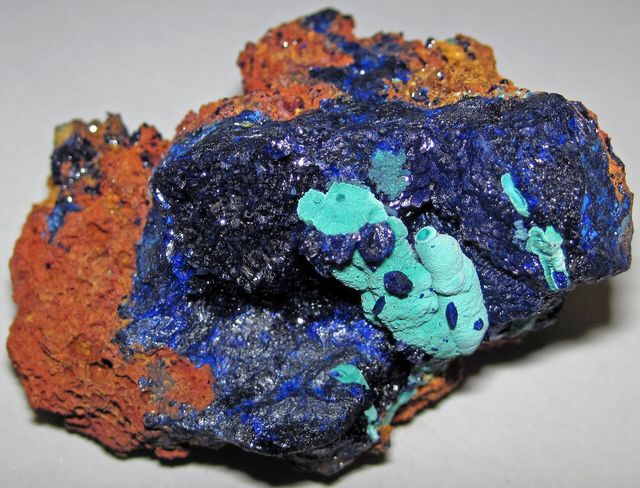
Morenci
The largest copper operation in North America.
Où c'est traité et raffiné
| Usine | Type | Étape | Pays | Rôle |
|---|---|---|---|---|
| CATL Ningde Plants | Gigafactory | Composant | China | Intrant |
| Gigafactory Nevada | Gigafactory | Composant | United States | Intrant |
| Samsung Pyeongtaek Campus | Fab de semiconducteurs | Composant | South Korea | Intrant |
| TSMC Fab 18, Tainan | Fab de semiconducteurs | Composant | Taiwan | Intrant |
| Atlantic Copper Smelter, Huelva | Fonderie | Traitement | Spain | Intrant |
| Guixi Smelter | Fonderie | Traitement | China | Intrant |
| Nadezhda Metallurgical Plant | Fonderie | Traitement | Russia | Production |
| Port of Rotterdam Bulk Terminals | Port | Traitement | Netherlands | Intrant |
| Wind Turbine Nacelle & Blade Plants, Jutland | Usine de fabrication | Produit | Denmark | Intrant |
| Jinchuan Group Smelter-Refinery | Affinerie | Affinage | China | Production |
À quoi cela sert
Tous les marchés finaux →| Marché final | Ce qu'il fait là-bas | Importance |
|---|---|---|
| Electric Vehicles | Current collectors, motor windings, busbars and charging | Définition de |
| Power Grids | Cables, windings and busbars | Définition de |
| Data Centres & AI | Power distribution, busbars and network cable | Définition de |
| Wind Power | Generator windings, nacelle wiring and export cable | Définition de |
| Solar Power | Ribbon, wiring and inverters | Définition de |
| Construction & Steel | Wiring and plumbing | Définition de |
| Semiconductors | On-chip interconnect | Définition de |
| Consumer Electronics | Boards, coils and wiring | Définition de |
| Robotics & Automation | Motor windings and wiring | Définition de |
| Hydrogen & Electrolysis | Power delivery at very high current | Définition de |
| Grid Storage | Collectors and connection | Définition de |
| Nuclear Power | Generator and switchyard | Important |
Quelle quantité en nécessite une technologie
| Technologie | Quantité | Coté | Base |
|---|---|---|---|
| Alkaline Electrolyser | 400.0–1,200 kg | per MW of capacity | Power delivery |
| Crystalline Silicon Solar Module | 2,000–4,000 kg | per MW of capacity | Wiring, ribbon and inverter |
| Direct-Drive Offshore Wind Turbine Offshore is far higher than onshore. | 3,000–8,000 kg | per MW of capacity | Generator, nacelle and array cabling |
| EV Traction Motor | 8.00–20.00 kg | per motor | Stator windings |
| HVDC Transmission Cable | 20.00–120.0 t | per km of circuit | Conductor, subsea designs at the high end |
| LFP Lithium-Ion Battery | 15.00–25.00 kg | per 75 kWh pack | Foil and busbars |
| NMC Lithium-Ion Battery | 15.00–25.00 kg | per 75 kWh pack | Foil and busbars, cell and pack only |
| PEM Electrolyser | 500.0–1,500 kg | per MW of capacity | Very high-current power delivery |
| Pressurised Water Reactor | 1,000–2,000 t | per GW of capacity | Generator, transformers and plant wiring |
| Vanadium Redox Flow Battery | 1.00–3.00 t | per MWh of storage | Stack and power conversion |
Indicative range compiled from published technology studies and chemistry; verify against a manufacturer specification before use. Appliquer ces chiffres à n'importe quelle échelle dans le calculateur de matériaux →
Contrôles à l'exportation
| Pays | Contrôle | S'applique à |
|---|---|---|
| Indonesia | Export ban | Bauxite (2023), copper concentrates (2023), and nickel ore (2020). ↗ |
| Laos | Export ban | Raw minerals, including copper, gold, iron, nickel, potassium, silver, and zinc (2024). ↗ |
| Morocco | Export licensing requirement | Copper (refined and alloys) and aluminum ingots (2025). ↗ |
| Tanzania | Export ban | Ore concentrates of copper, gold, nickel, and silver (2017). ↗ |
| Venezuela | Export ban | Bauxite, cassiterite, columbite-tantalite, copper, gold, rhodium, silver, and thorium (2024). ↗ |
USGS Mineral Commodity Summaries 2026, table 4 — controls in effect as of January 2026, excluding controls since lifted.
Suivez-le au fil des frontières
Tous les parcours →Où va réellement un lot de ce matériau — chaque pays, chaque dépositaire, et ce qui est perdu à chaque étape.
Chilean sulfide concentrate to Chinese cathode to a wire Chile mines the most copper in the world. China refines the most. Those are not the same sentence. Congolese oxide ore to finished cathode, without a smelter When the ore is oxide, acid will do what a smelter would otherwise have to.