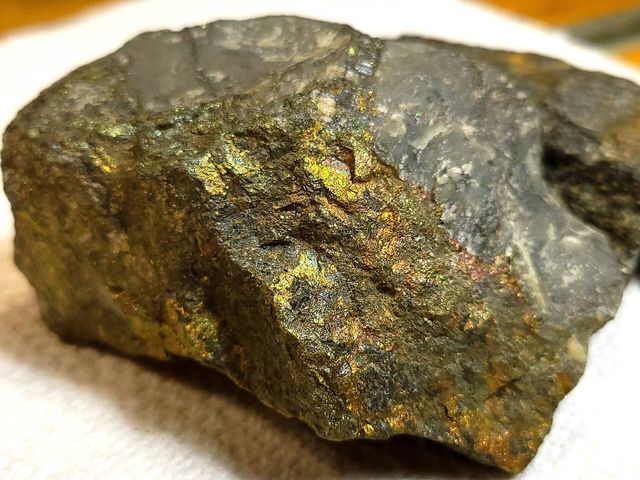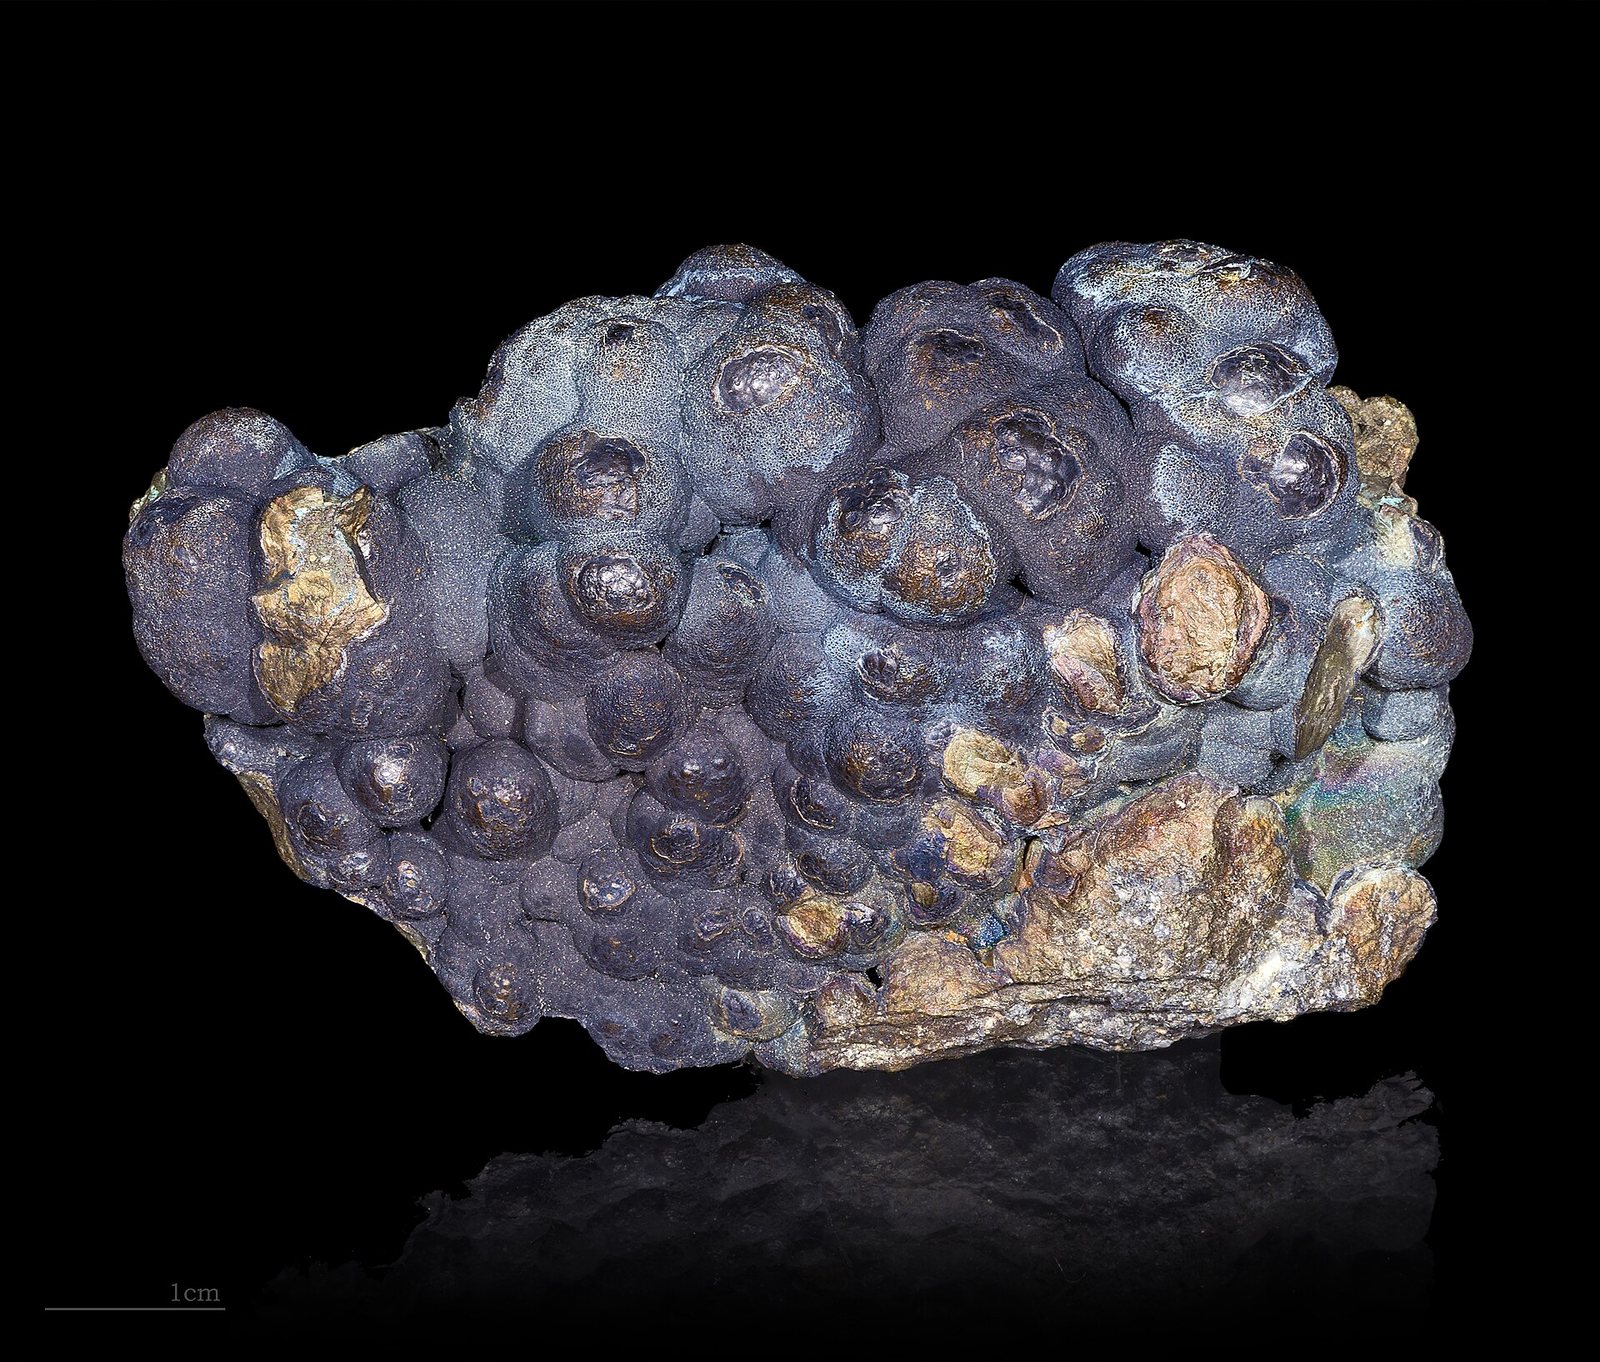
Apa ini?
The reddish metal that carries electricity better than anything except silver, and which humans have been smelting for about 7,000 years.
Mengapa ini penting?
Every kilowatt-hour generated has to travel down copper. Grids, motors, data centres, buildings and vehicles all compete for the same refined metal.
Where it is in the Earth
Where it is in the Earth
Copper is one of the more abundant metals in the Earth's crust, but it is almost never concentrated enough to mine in its natural, dispersed state. What makes a copper deposit is a geological process that gathered the metal from large volumes of rock and deposited it in a much smaller volume over millions of years. The most important of these processes produces what geologists call a porphyry copper deposit. The word porphyry describes a type of igneous rock — rock that solidified from magma — in which large crystals are set inside a finer-grained mass. When magma rises towards the surface and begins to cool, water and other hot fluids are expelled. Those fluids scavenge copper from the surrounding rock, travel along fractures, and eventually deposit sulfide minerals — principally chalcopyrite, a compound of copper, iron and sulfur — as conditions change. The result is a very large, low-grade body of mineralised rock. Porphyry deposits account for the great majority of the world's mined copper, and they explain why Chile, Peru and parts of the American Southwest — all sitting on or near the ancient collision zone where the Pacific oceanic plate has driven under the South American and North American continents — hold so much of the world's reserves.
A second important deposit type is the sediment-hosted stratiform deposit, where copper minerals were laid down in ancient sedimentary basins, probably by metal-bearing brines circulating through porous rock. The Congolese Copperbelt and the Zambian Copperbelt formed this way, and they tend to carry higher grades than porphyries, with a different mix of ore minerals including bornite and chalcocite alongside chalcopyrite. A third type, found at Norilsk in Russia and Sudbury in Canada, is the magmatic sulfide deposit, formed when copper, nickel and other metals separated from a cooling magma body and settled together. These are typically mined as much for nickel or platinum-group metals as for copper itself. The common thread in all cases is that geological time and energy — heat, pressure, fluid movement — did the work of concentration that makes mining economically feasible.
Near the surface, many copper sulfide deposits are chemically altered by weathering. Rainwater carrying oxygen and weak acids reacts with sulfide minerals, dissolves the copper, and redeposits it lower in the profile as very high-grade secondary minerals — chalcocite and bornite in the sulfide zone, and carbonates such as malachite in the oxide zone above the water table. This process is called supergene enrichment, and it explains why some deposits have a rich cap of oxide ore sitting above a lower-grade primary sulfide body. The oxide and sulfide portions require different processing routes, which has practical consequences at the mine.
Getting it out
Getting it out
Because porphyry copper deposits are very large and typically low-grade — ore grades of roughly 0.3 to 1 percent copper are normal — they are almost always mined by open pit methods. Open pit mining involves removing rock from a progressively deepening pit, blasting it loose in benches, and loading it onto trucks or conveyors. The defining feature of this approach is the sheer volume of waste. For every tonne of ore that carries copper, several tonnes of waste rock — material too lean to process — must be moved and stored somewhere. The ratio of waste to ore, called the strip ratio, varies by deposit but is often substantial; as a pit deepens over decades, the strip ratio tends to rise, increasing energy and haulage costs per tonne of copper recovered. Open pit mines are among the largest human-made structures on Earth for exactly this reason.
Underground mining becomes the preferred option when the orebody is deep, when the surface topography makes an open pit impractical, or when the ore is high-grade enough to justify the greater cost of driving tunnels and shafts. El Teniente in Chile, the world's largest underground copper mine, uses a technique called block caving: miners undercut a large block of rock, which then collapses under its own weight and is drawn off through tunnels below. Block caving can move very large tonnages at relatively low cost per tonne once established, but it requires long lead times to prepare and cannot be easily accelerated. Some deposits, like Oyu Tolgoi in Mongolia, use both open pit and underground methods at different stages of their life.
A distinct extraction route applies to oxide copper ores. Rather than crushing and concentrating the rock, operators heap it onto lined pads and irrigate it with dilute sulfuric acid. The acid dissolves the copper out of the rock, and the resulting copper-rich solution is then processed through a two-stage electrochemical system — solvent extraction followed by electrowinning, universally abbreviated SX-EW — to produce copper cathode directly, without passing through a smelter. This route is well suited to arid regions where water is scarce, since the acid solution is largely recycled, and it avoids the sulfur dioxide emissions associated with smelting sulfide ores. Morenci in Arizona is a large example. However, SX-EW cathode cannot easily carry the by-product credits — gold, silver, molybdenum — that make sulfide concentrate economics attractive, because those metals do not dissolve in the acid leach.
What pulls on it
What pulls on it
Copper is bought primarily because it conducts electricity. Its electrical conductivity is exceeded only by silver, which is far scarcer and more expensive, so copper has been the default conductor in almost every electrical application for well over a century. Construction — the wiring inside buildings — has historically been the largest single end-use, and it remains very large. Industrial machinery, power generation and transmission, and transport have always competed alongside it. None of these uses are going away; replacing the wiring in existing buildings alone represents a continuing, replacement-driven demand that is largely independent of economic cycles.
What has changed the shape of demand in recent years is the scale of electrification underway in energy and transport. The material-intensity figures in the database illustrate the point concretely: a direct-drive offshore wind turbine requires between 3,000 and 8,000 kilograms of copper per megawatt of capacity, a photovoltaic solar installation between 2,000 and 4,000 kilograms per megawatt, and a pressurised water reactor between 1,000 and 2,000 tonnes per gigawatt. Electric vehicles carry copper in their motor windings, battery current collectors, busbars and charging infrastructure. Data centres, whose power consumption has risen sharply with the expansion of computing capacity for artificial intelligence workloads, require dense copper wiring in busbars, power distribution and network cables. All of these are applications where growth in the installed base translates directly into demand for new copper, not merely replacement copper.
For demand to change sharply in a downward direction, one of a small number of things would have to be true: a viable, affordable substitute would have to emerge at scale in one or more of the high-volume applications; electrification programmes would have to slow or reverse; or economic growth in the regions that build and wire the most infrastructure would have to stall for an extended period. For demand to exceed what current supply capacity can deliver, the current pace of energy transition and data-infrastructure build-out would need to be sustained while new mine supply takes the time it typically requires to come online.
Dari mana asalnya di dalam batuan
Semua mineral bijih →Inilah mineral yang sesungguhnya menjadi pembawa copper. Suatu endapan hanya menjadi badan bijih jika salah satunya cukup terkonsentrasi untuk menutup biaya penambangannya.
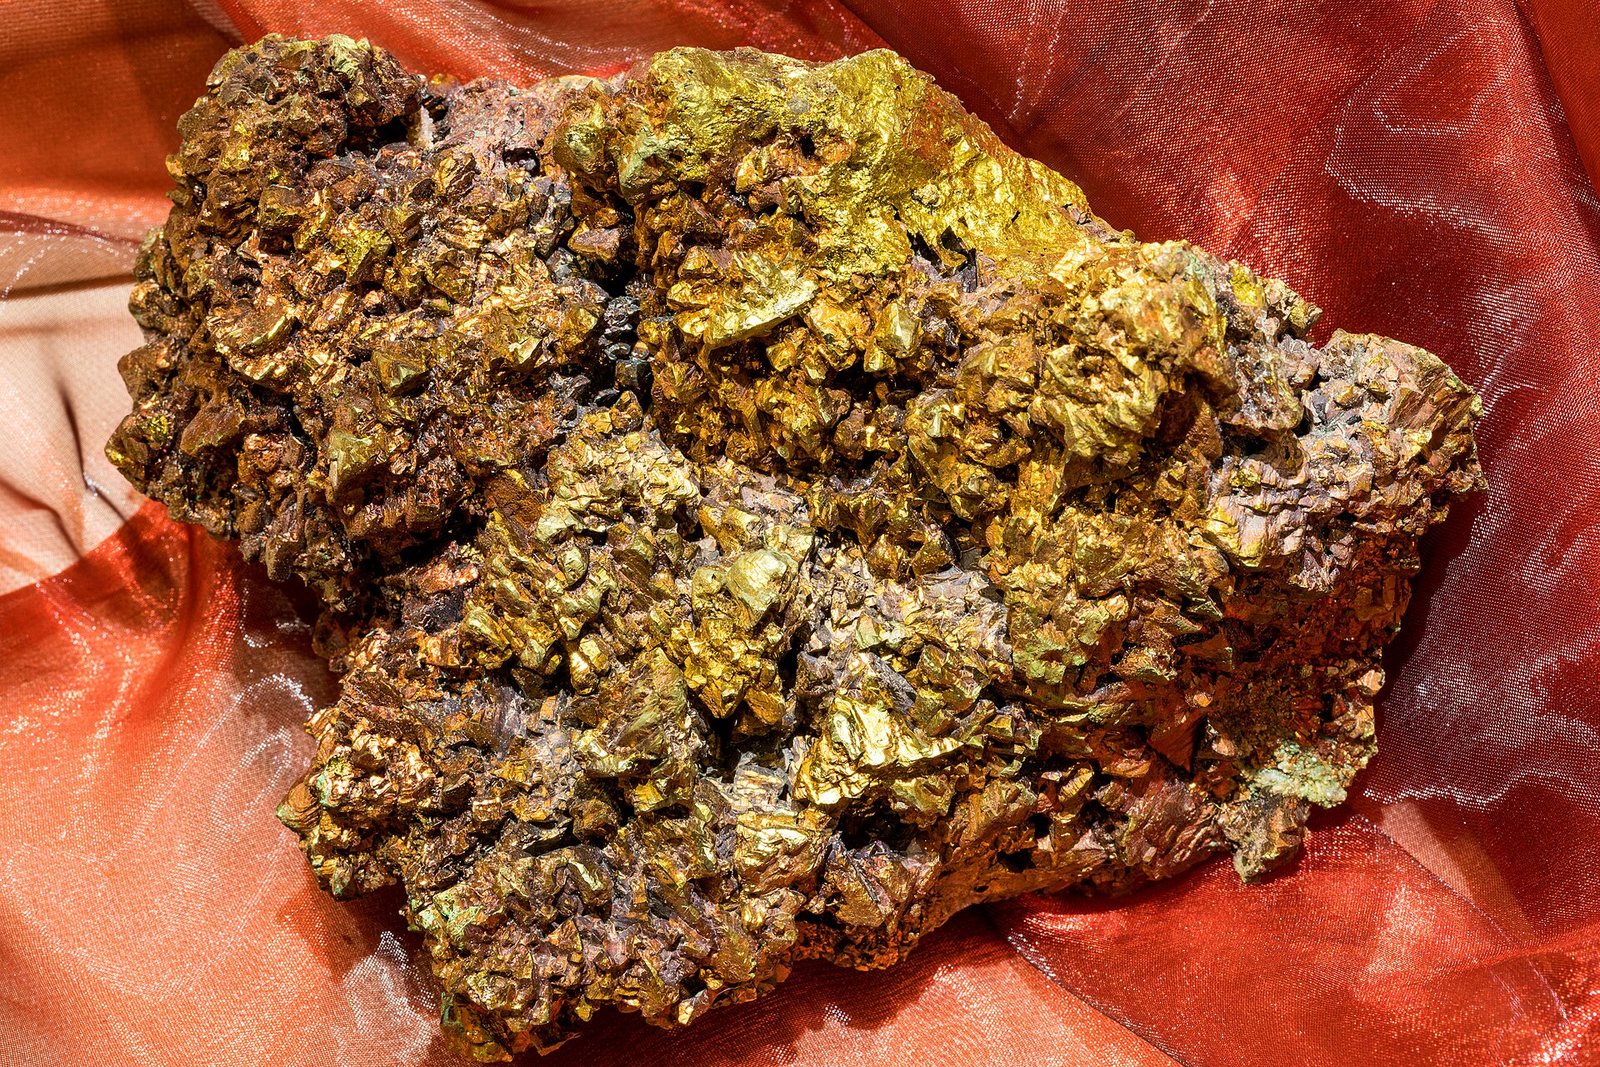
Chalcopyrite
The most important copper ore mineral on Earth. About 34% copper by weight when pure; typical ore grades are under 1%.
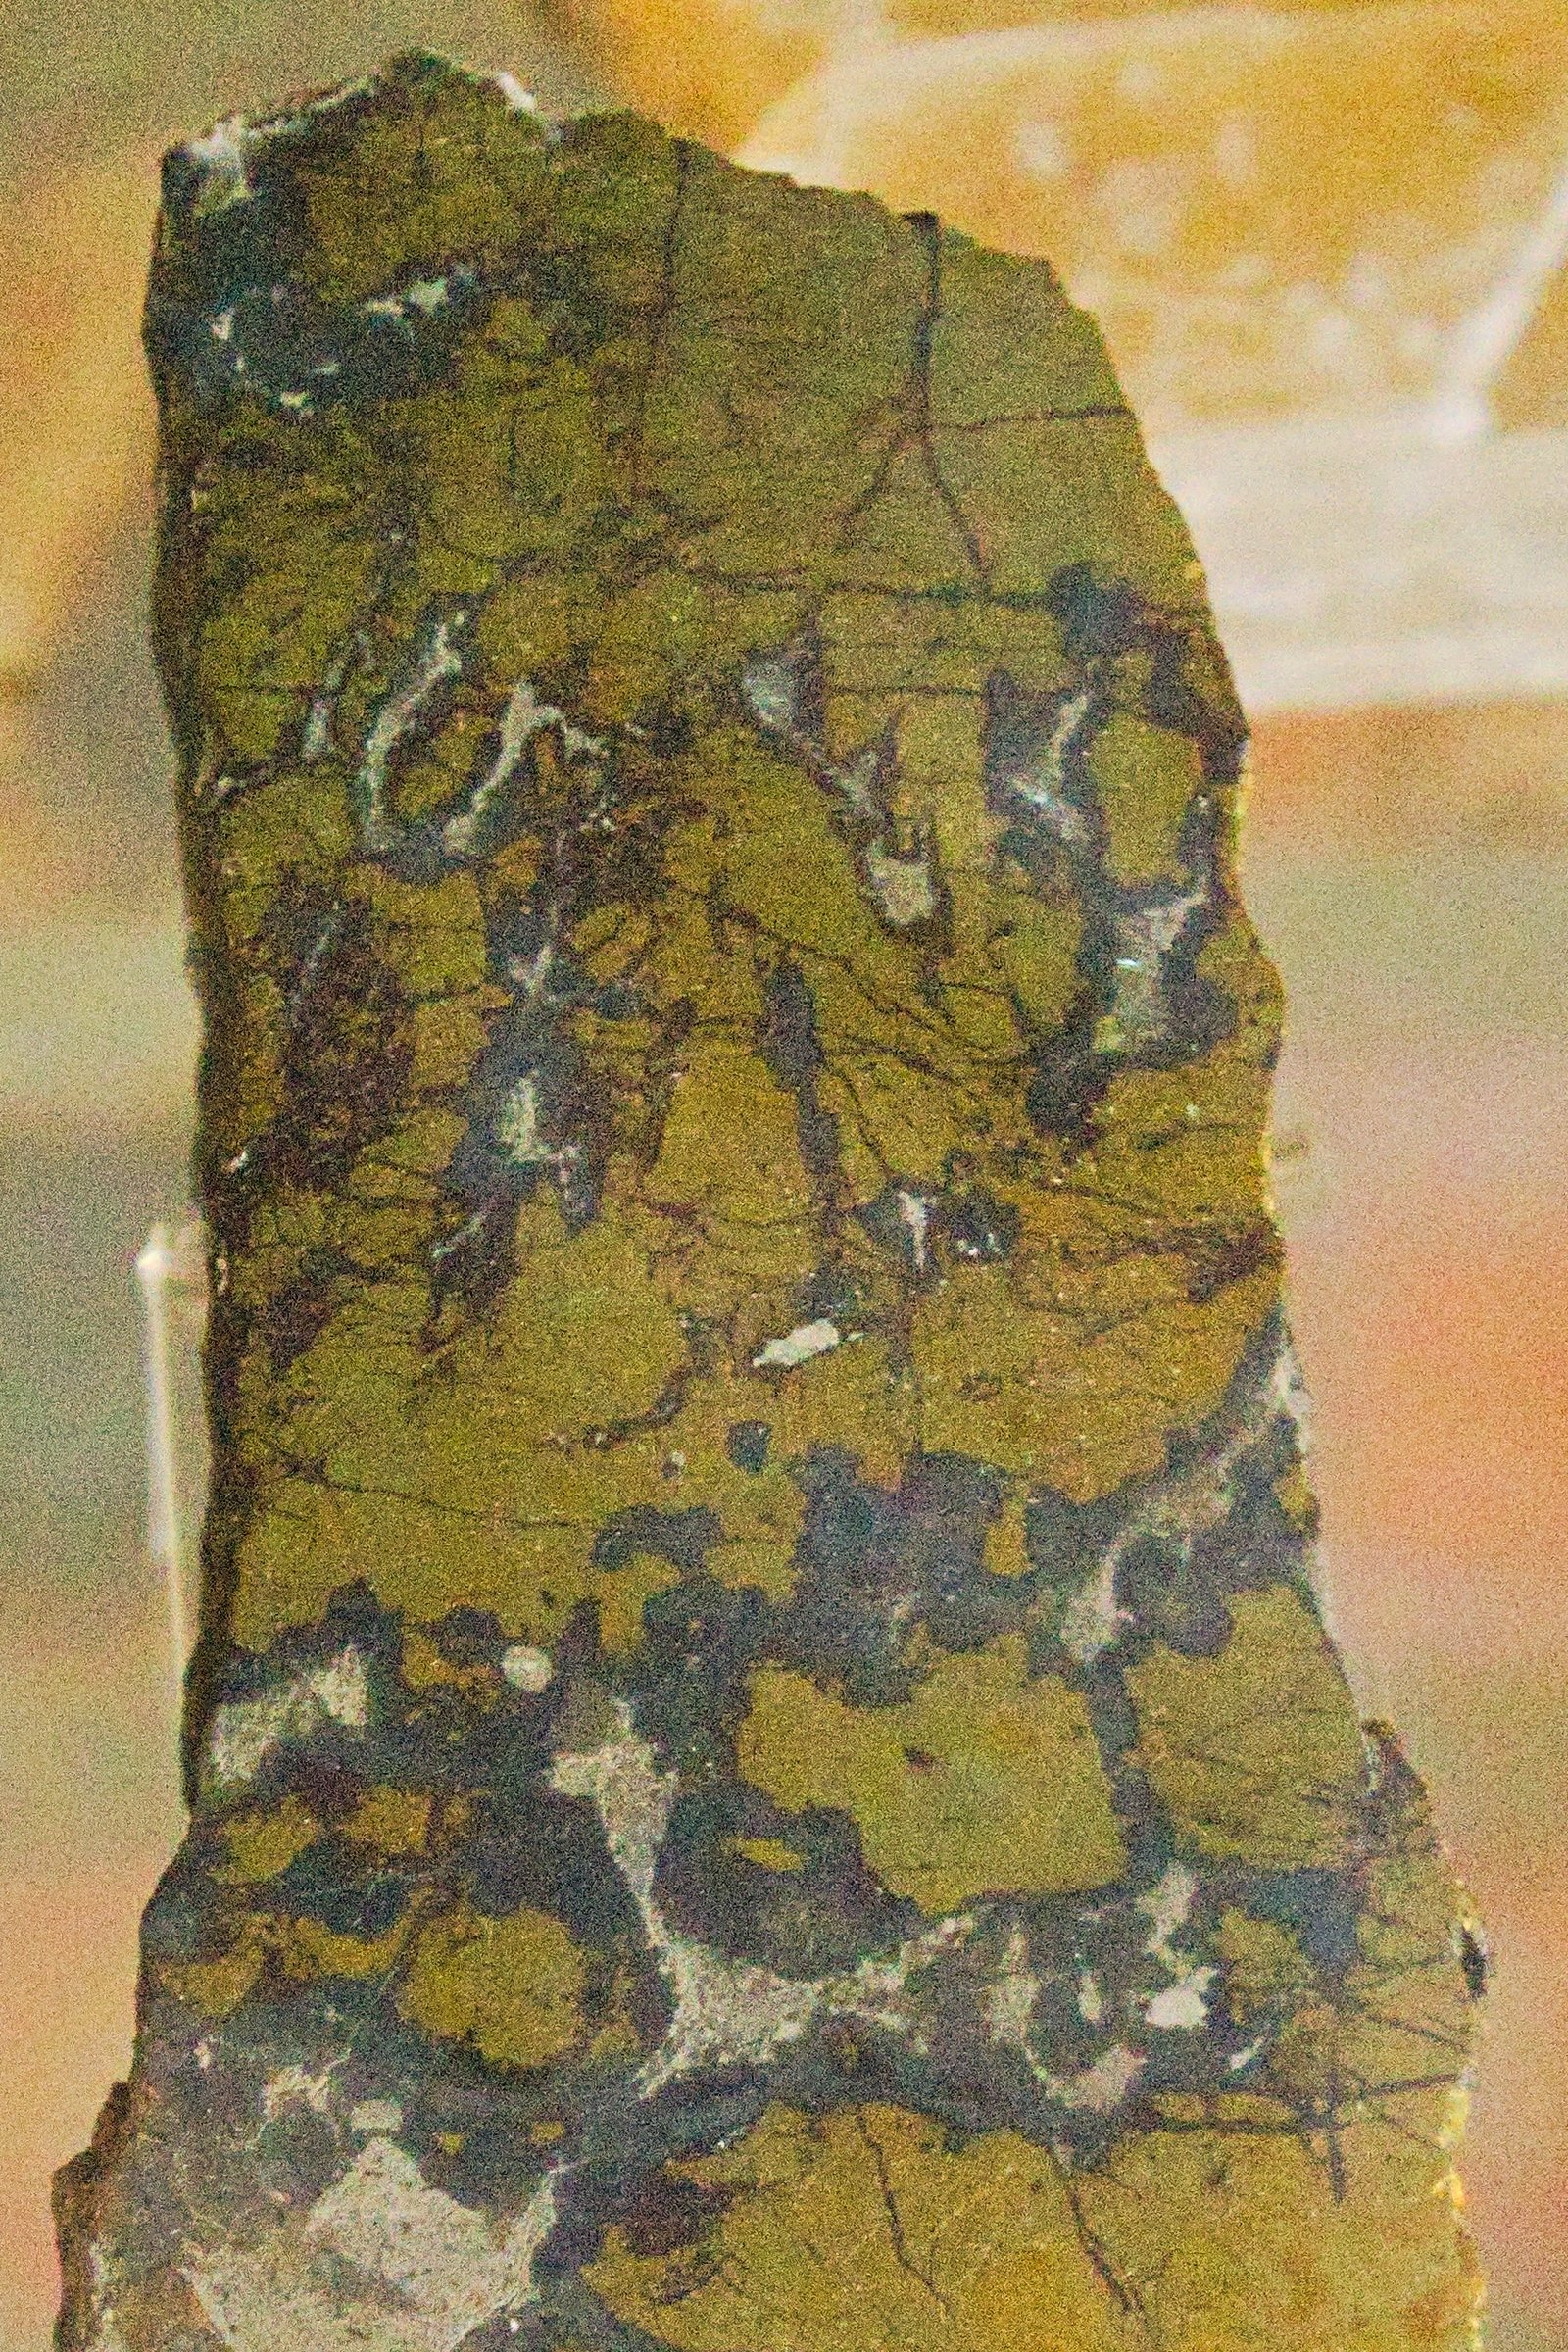
Bornite
A richer copper sulfide than chalcopyrite at about 63% Cu, common in the upper enriched zones of porphyry deposits.
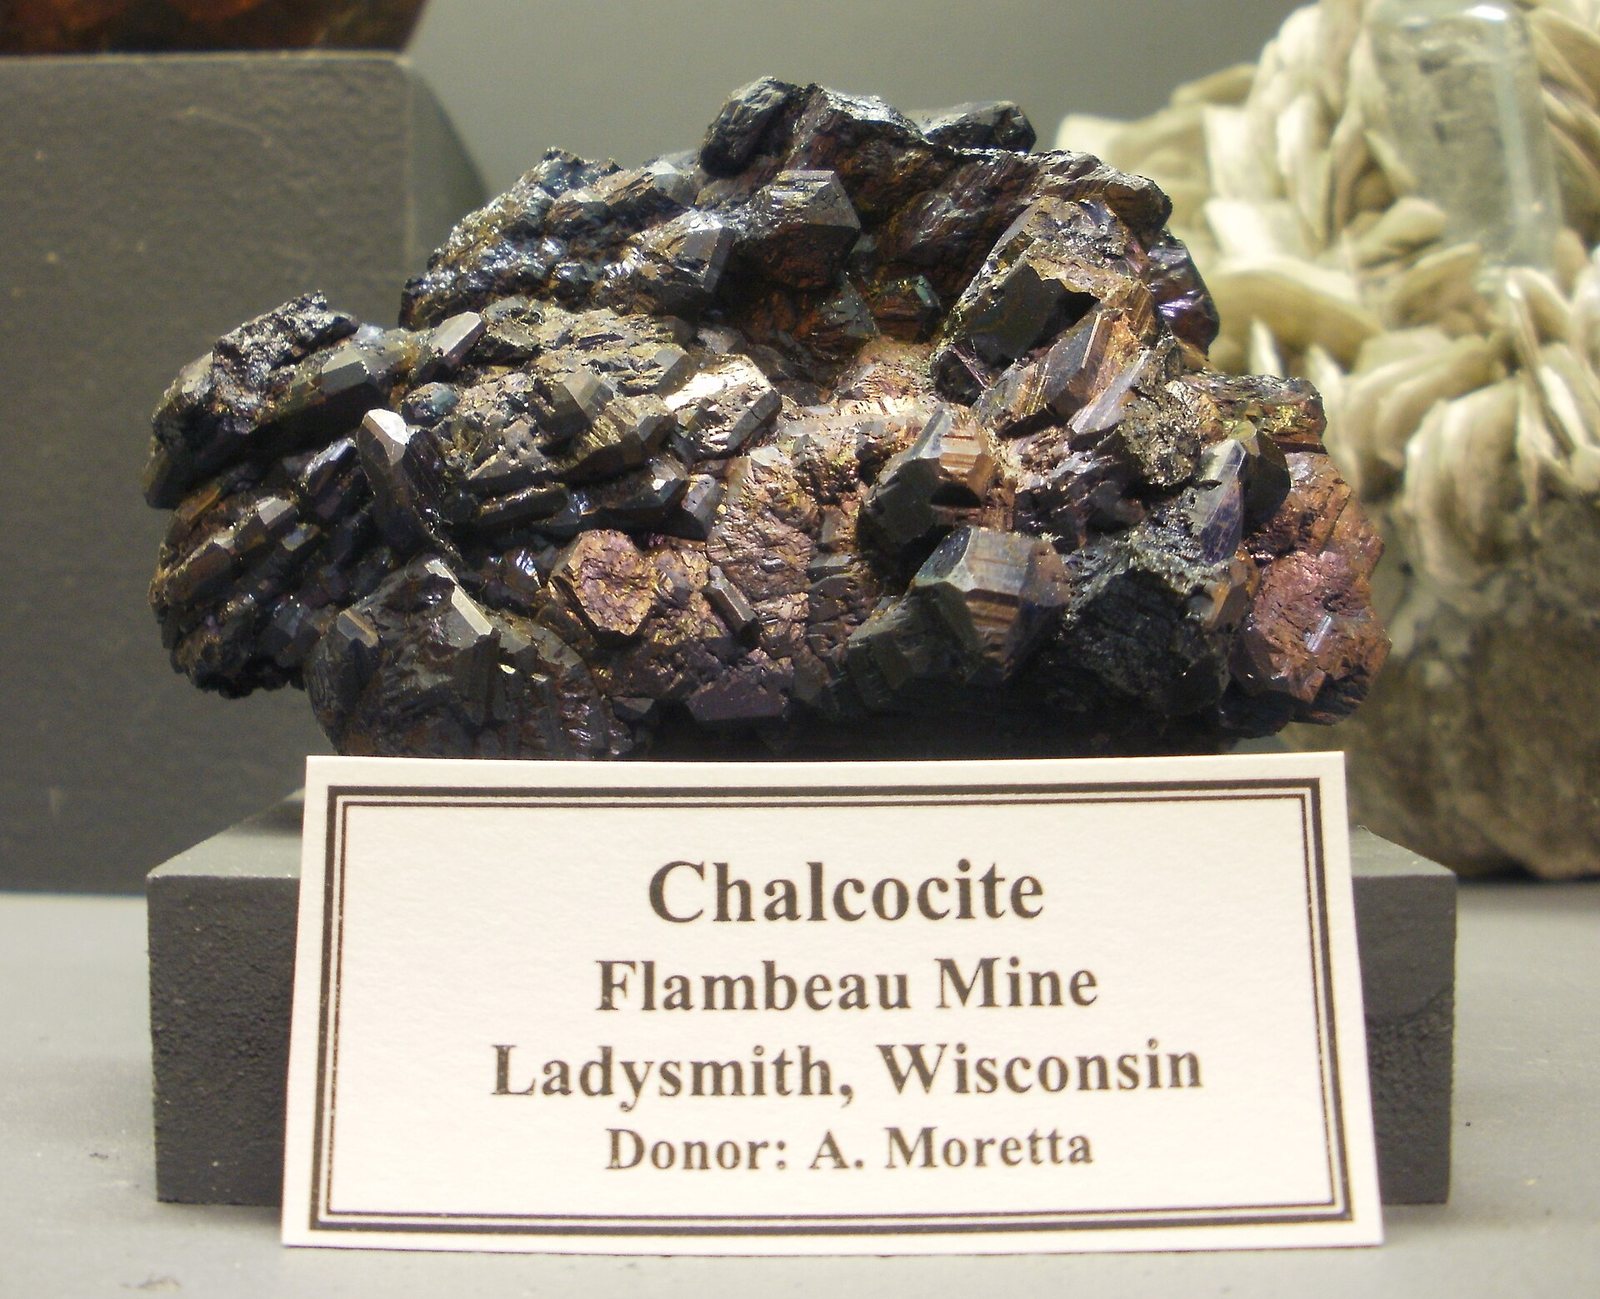
Chalcocite
The richest common copper sulfide, near 80% Cu, formed where weathering has redeposited copper below the water table.
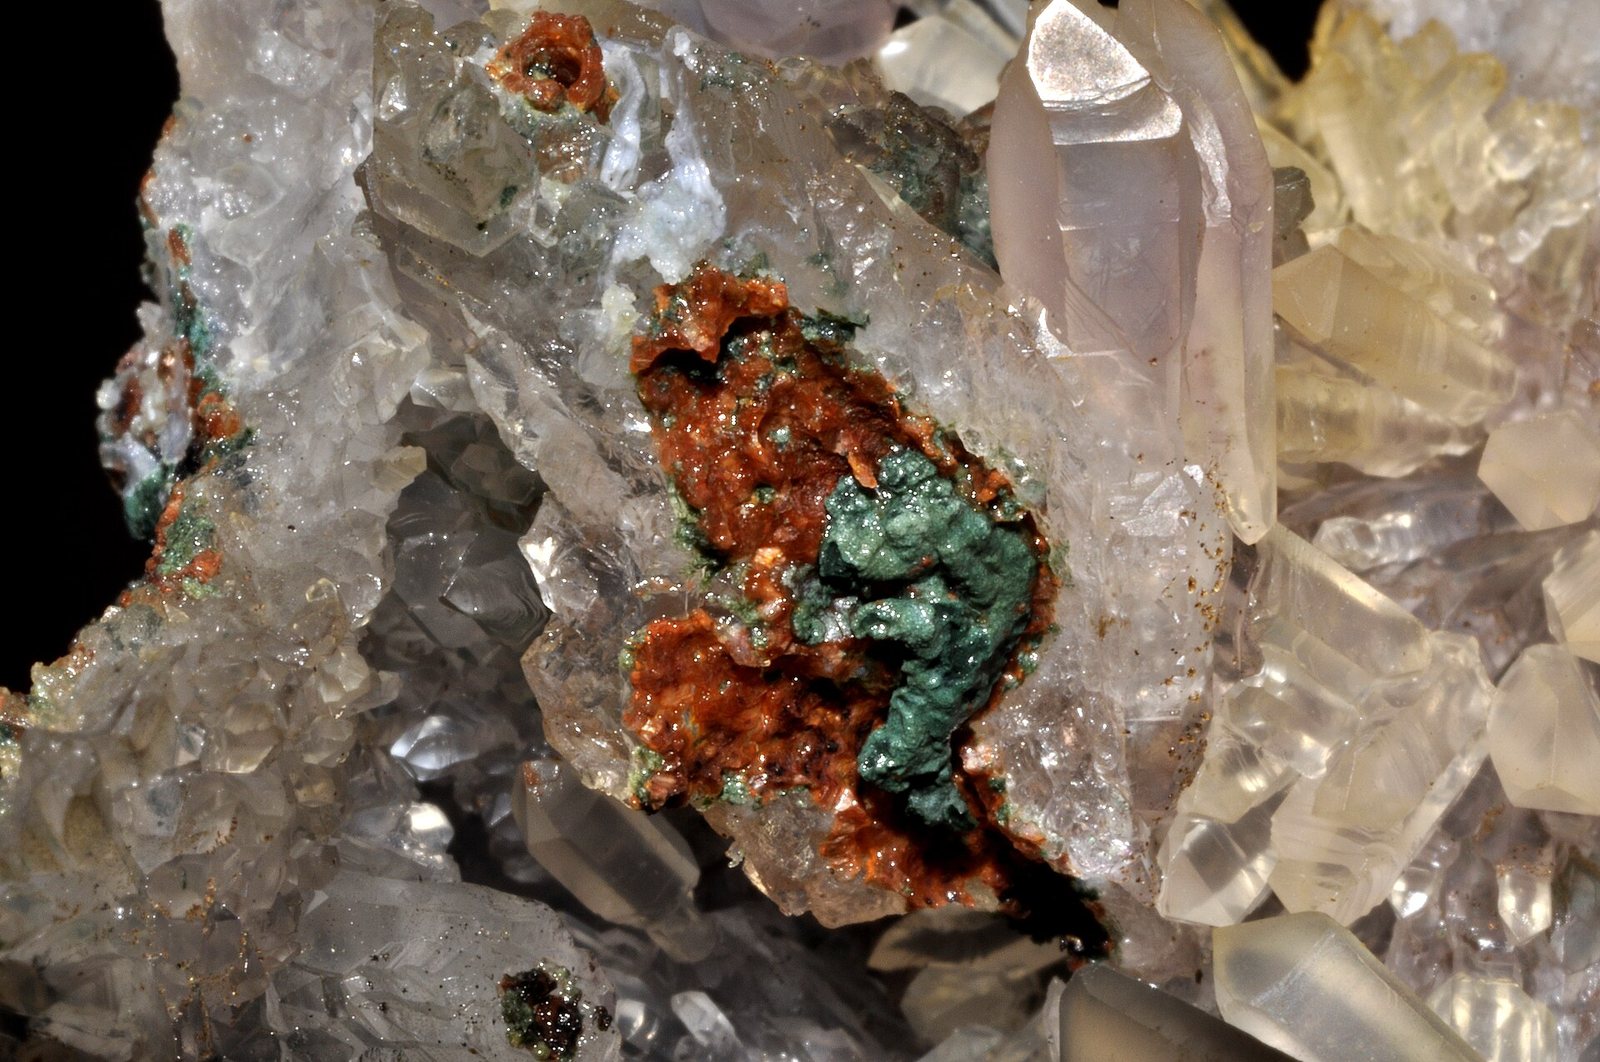
Malachite
An oxidised copper mineral. Leachable with acid without smelting, which is why oxide caps are mined first.
Siapa yang memproduksinya
Lihat di peta →Mine production
Mine productionthousand metric tons 2025 (estimasi) Total dunia 23,000 thousand metric tons
USGS Mineral Commodity Summaries 2026 · Mine production is contained copper in concentrate or cathode; refinery production is finished cathode. Adding the two double-counts. · sumber ↗
Gulir tabel ke samping untuk melihat kolom-kolom yang tersisa.
| Negara | Produksi | Pangsa dunia |
|---|---|---|
| Chile | 5,300 | 23.0% |
| Congo (Kinshasa) | 3,200 | 13.9% |
| Other countries | 3,000 | 13.0% |
| Peru | 2,700 | 11.7% |
| China | 1,800 | 7.8% |
| Russia | 1,300 | 5.7% |
| United States | 1,000 | 4.3% |
| Zambia | 940.0 | 4.1% |
| Australia | 730.0 | 3.2% |
| Kazakhstan | 710.0 | 3.1% |
| Indonesia | 710.0 | 3.1% |
| Mexico | 690.0 | 3.0% |
| Canada | 500.0 | 2.2% |
| Poland | 410.0 | 1.8% |
| India | 23.00 | 0.1% |
| Korea, Republic of | Zero | — |
| Germany | Zero | — |
| Japan | Zero | — |
| Total dunia | 23,000 | 100% |
Refinery production
Refinery productionthousand metric tons 2025 (estimasi) Total dunia 29,000 thousand metric tons
USGS Mineral Commodity Summaries 2026 · Mine production is contained copper in concentrate or cathode; refinery production is finished cathode. Adding the two double-counts. · sumber ↗
Gulir tabel ke samping untuk melihat kolom-kolom yang tersisa.
| Negara | Produksi | Pangsa dunia |
|---|---|---|
| China | 14,000 | 48.3% |
| Congo (Kinshasa) | 2,800 | 9.7% |
| Other countries | 2,100 | 7.2% |
| Chile | 1,700 | 5.9% |
| Japan | 1,400 | 4.8% |
| Russia | 950.0 | 3.3% |
| United States | 850.0 | 2.9% |
| India | 620.0 | 2.1% |
| Korea, Republic of | 610.0 | 2.1% |
| Germany | 610.0 | 2.1% |
| Poland | 560.0 | 1.9% |
| Kazakhstan | 500.0 | 1.7% |
| Mexico | 480.0 | 1.7% |
| Australia | 460.0 | 1.6% |
| Indonesia | 400.0 | 1.4% |
| Peru | 340.0 | 1.2% |
| Canada | 320.0 | 1.1% |
| Zambia | 270.0 | 0.9% |
| Total dunia | 29,000 | 100% |
"Ditahan" berarti USGS menyembunyikan angka tersebut untuk menghindari pengungkapan data perusahaan tertentu — bukan berarti nol. Baris per negara tidak selalu berjumlah sama dengan total dunia karena sumber membulatkan setiap angka secara independen dan tidak selalu merinci baris "negara lain".
Siapa yang memegang cadangan
Reserves
Reservesthousand metric tons 2025
USGS Mineral Commodity Summaries 2026 · sumber ↗
| Negara | Cadangan | Pangsa dunia |
|---|---|---|
| Other countries | 210,000 | 21.4% |
| Chile | 180,000 | 18.4% |
| Australia | 100,000 | 10.2% |
| Peru | 85,000 | 8.7% |
| Russia | 80,000 | 8.2% |
| Congo (Kinshasa) | 80,000 | 8.2% |
| Mexico | 53,000 | 5.4% |
| United States | 47,000 | 4.8% |
| China | 41,000 | 4.2% |
| Poland | 33,000 | 3.4% |
| Indonesia | 21,000 | 2.1% |
| Zambia | 21,000 | 2.1% |
| Kazakhstan | 20,000 | 2.0% |
| Canada | 7,000 | 0.7% |
| India | 2,200 | 0.2% |
| Japan | Zero | — |
| Germany | Zero | — |
| Korea, Republic of | Zero | — |
| Total dunia | 980,000 | 100% |
Harga
Copper, global price
Rata-rata tahunanUS$ per tonne
Dasar: IMF global price of copper — grade A cathode, LME/COMEX/NYMEX average. Rata-rata tahunan sebagaimana diterbitkan dalam FRED (IMF primary commodity prices) · sumber ↗. Ini adalah rata-rata tahunan referensi, bukan kuotasi pasar secara langsung.
annual average, cents per pound: COMEX, high-grade, first position
Rata-rata tahunancents per pound
Dasar: annual average, cents per pound: COMEX, high-grade, first position. Rata-rata tahunan sebagaimana diterbitkan dalam USGS Mineral Commodity Summaries 2026 · sumber ↗. Ini adalah rata-rata tahunan referensi, bukan kuotasi pasar secara langsung.
annual average, cents per pound: U.S. producer, cathode (COMEX + premium)
Rata-rata tahunancents per pound
Dasar: annual average, cents per pound: U.S. producer, cathode (COMEX + premium). Rata-rata tahunan sebagaimana diterbitkan dalam USGS Mineral Commodity Summaries 2026 · sumber ↗. Ini adalah rata-rata tahunan referensi, bukan kuotasi pasar secara langsung.
annual average, cents per pound: London Metal Exchange, grade A, cash
Rata-rata tahunancents per pound
Dasar: annual average, cents per pound: London Metal Exchange, grade A, cash. Rata-rata tahunan sebagaimana diterbitkan dalam USGS Mineral Commodity Summaries 2026 · sumber ↗. Ini adalah rata-rata tahunan referensi, bukan kuotasi pasar secara langsung.
Tambang yang memproduksinya
Semua tambang →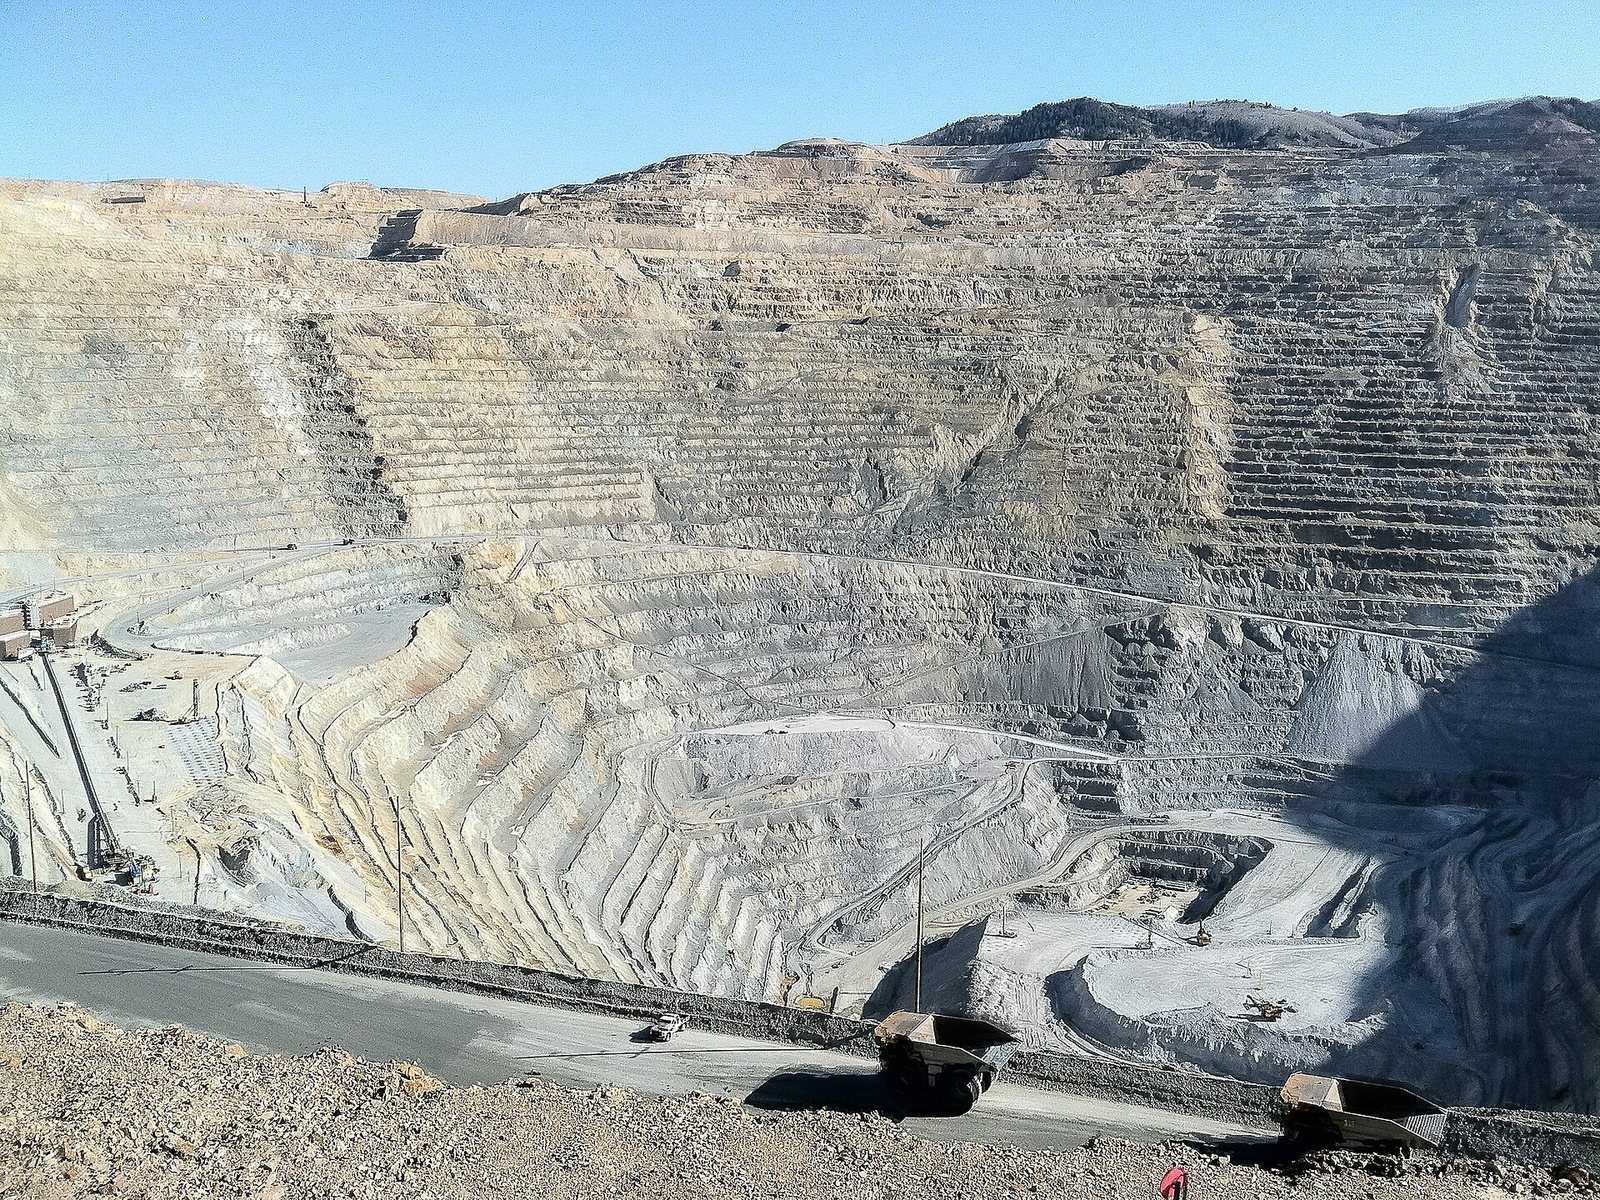
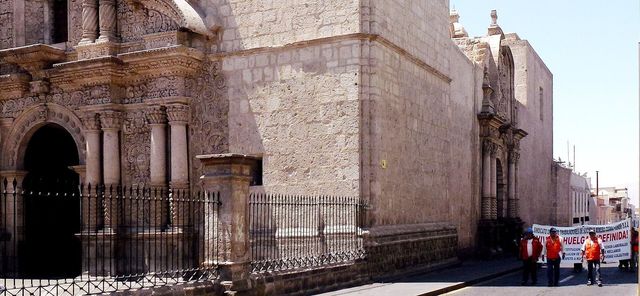
Cerro Verde
One of the largest concentrator complexes in the world by throughput.
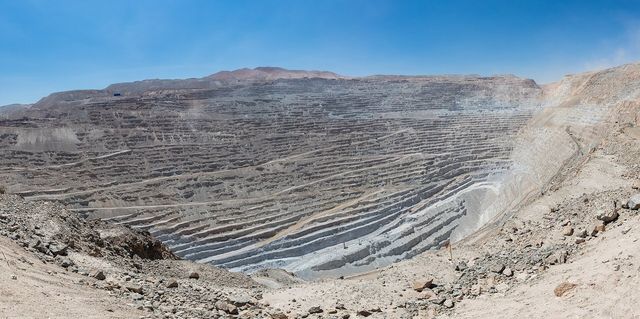
Chuquicamata
Historically the largest open-pit copper mine in the world by excavated volume.
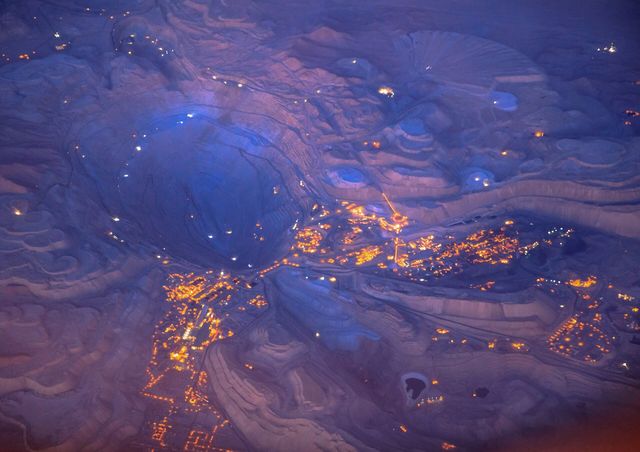
Collahuasi
Among the largest copper mines by output.
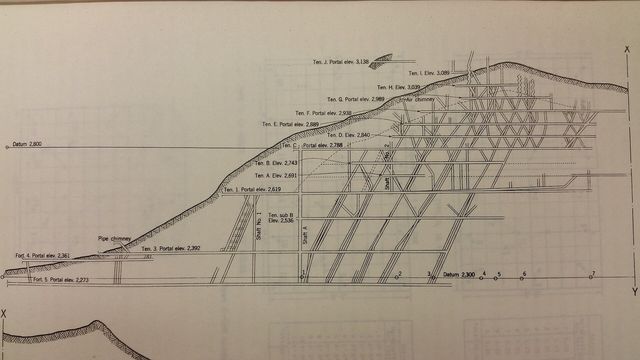
El Teniente
The largest underground copper mine in the world by excavated extent.
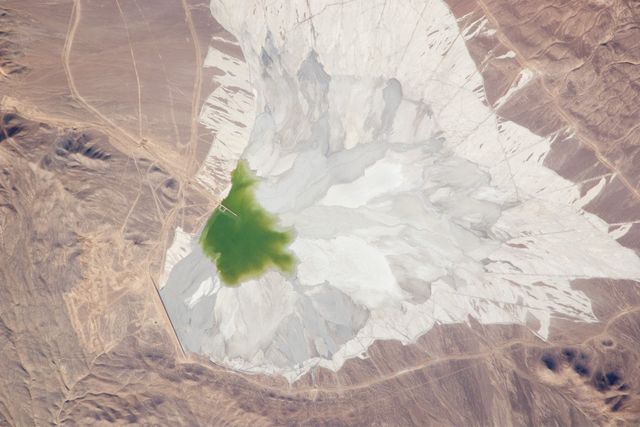
Escondida
Consistently the largest copper mine in the world by output.
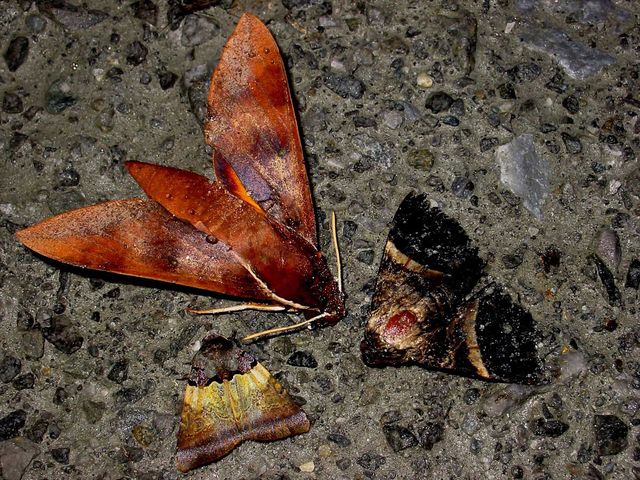
Grasberg
One of the largest copper deposits and among the largest gold deposits ever mined.
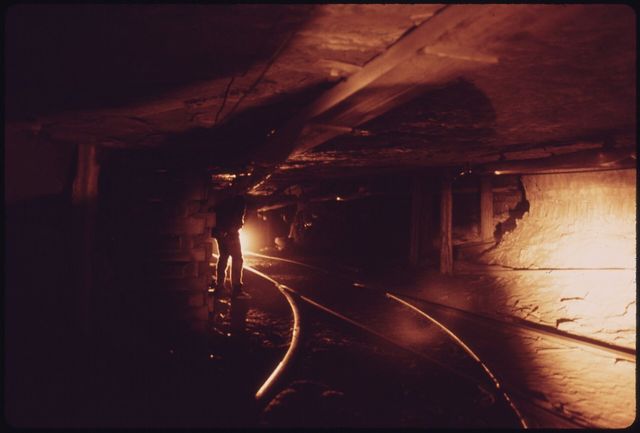
Kamoa-Kakula
One of the highest-grade large copper deposits discovered in decades.
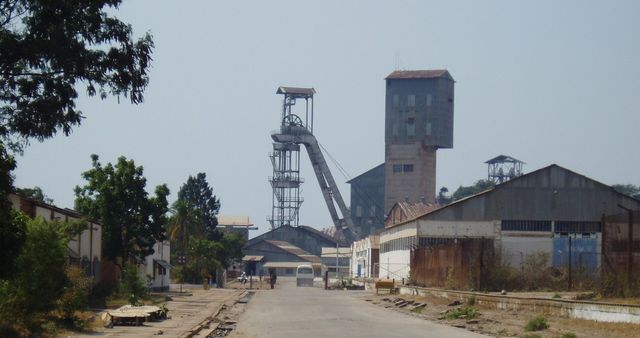
Kamoto (KCC)
Among the world's largest cobalt producers.
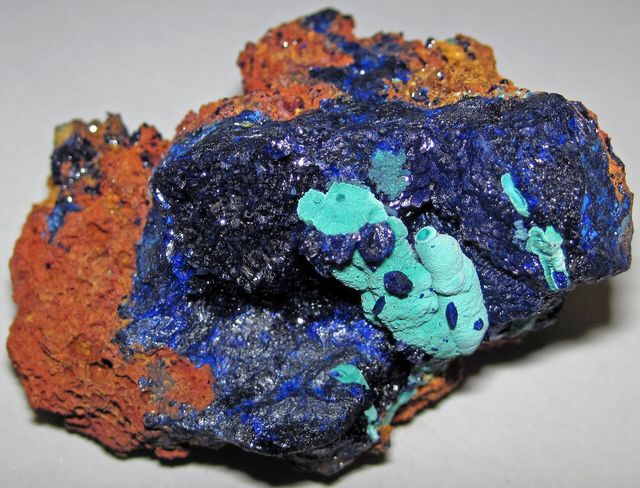
Morenci
The largest copper operation in North America.
Di mana material diproses dan dimurnikan
| Fasilitas | Jenis | Tahap | Negara | Peran |
|---|---|---|---|---|
| CATL Ningde Plants | Gigafabrik | Komponen | China | Masukan |
| Gigafactory Nevada | Gigafabrik | Komponen | United States | Masukan |
| Samsung Pyeongtaek Campus | Fab semikonduktor | Komponen | South Korea | Masukan |
| TSMC Fab 18, Tainan | Fab semikonduktor | Komponen | Taiwan | Masukan |
| Atlantic Copper Smelter, Huelva | Smelter | Pemrosesan | Spain | Masukan |
| Guixi Smelter | Smelter | Pemrosesan | China | Masukan |
| Nadezhda Metallurgical Plant | Smelter | Pemrosesan | Russia | Keluaran |
| Port of Rotterdam Bulk Terminals | Pelabuhan | Pemrosesan | Netherlands | Masukan |
| Wind Turbine Nacelle & Blade Plants, Jutland | Pabrik manufaktur | Produk | Denmark | Masukan |
| Jinchuan Group Smelter-Refinery | Kilang | Pemurnian | China | Keluaran |
Untuk apa digunakan
Semua pasar akhir →| Pasar akhir | Apa yang dilakukannya di sana | Kepentingan |
|---|---|---|
| Electric Vehicles | Current collectors, motor windings, busbars and charging | Mendefinisikan |
| Power Grids | Cables, windings and busbars | Mendefinisikan |
| Data Centres & AI | Power distribution, busbars and network cable | Mendefinisikan |
| Wind Power | Generator windings, nacelle wiring and export cable | Mendefinisikan |
| Solar Power | Ribbon, wiring and inverters | Mendefinisikan |
| Construction & Steel | Wiring and plumbing | Mendefinisikan |
| Semiconductors | On-chip interconnect | Mendefinisikan |
| Consumer Electronics | Boards, coils and wiring | Mendefinisikan |
| Robotics & Automation | Motor windings and wiring | Mendefinisikan |
| Hydrogen & Electrolysis | Power delivery at very high current | Mendefinisikan |
| Grid Storage | Collectors and connection | Mendefinisikan |
| Nuclear Power | Generator and switchyard | Penting |
Seberapa banyak yang dibutuhkan suatu teknologi
| Teknologi | Kuantitas | Dikutip | Dasar |
|---|---|---|---|
| Alkaline Electrolyser | 400.0–1,200 kg | per MW of capacity | Power delivery |
| Crystalline Silicon Solar Module | 2,000–4,000 kg | per MW of capacity | Wiring, ribbon and inverter |
| Direct-Drive Offshore Wind Turbine Offshore is far higher than onshore. | 3,000–8,000 kg | per MW of capacity | Generator, nacelle and array cabling |
| EV Traction Motor | 8.00–20.00 kg | per motor | Stator windings |
| HVDC Transmission Cable | 20.00–120.0 t | per km of circuit | Conductor, subsea designs at the high end |
| LFP Lithium-Ion Battery | 15.00–25.00 kg | per 75 kWh pack | Foil and busbars |
| NMC Lithium-Ion Battery | 15.00–25.00 kg | per 75 kWh pack | Foil and busbars, cell and pack only |
| PEM Electrolyser | 500.0–1,500 kg | per MW of capacity | Very high-current power delivery |
| Pressurised Water Reactor | 1,000–2,000 t | per GW of capacity | Generator, transformers and plant wiring |
| Vanadium Redox Flow Battery | 1.00–3.00 t | per MWh of storage | Stack and power conversion |
Indicative range compiled from published technology studies and chemistry; verify against a manufacturer specification before use. Jalankan angka-angka ini pada skala berapa pun dalam kalkulator material →
Kontrol ekspor
| Negara | Kontrol | Berlaku untuk |
|---|---|---|
| Indonesia | Export ban | Bauxite (2023), copper concentrates (2023), and nickel ore (2020). ↗ |
| Laos | Export ban | Raw minerals, including copper, gold, iron, nickel, potassium, silver, and zinc (2024). ↗ |
| Morocco | Export licensing requirement | Copper (refined and alloys) and aluminum ingots (2025). ↗ |
| Tanzania | Export ban | Ore concentrates of copper, gold, nickel, and silver (2017). ↗ |
| Venezuela | Export ban | Bauxite, cassiterite, columbite-tantalite, copper, gold, rhodium, silver, and thorium (2024). ↗ |
USGS Mineral Commodity Summaries 2026, table 4 — controls in effect as of January 2026, excluding controls since lifted.
Ikuti melintasi perbatasan
Semua perjalanan →Ke mana kiriman material ini sebenarnya pergi — setiap negara, setiap pengelola, dan apa yang tersisa di setiap langkah.
Chilean sulfide concentrate to Chinese cathode to a wire Chile mines the most copper in the world. China refines the most. Those are not the same sentence. Congolese oxide ore to finished cathode, without a smelter When the ore is oxide, acid will do what a smelter would otherwise have to.