Asia
China
この地から産出されるもの、地中に残るもの、および資産を操業する主体。
58 生産素材
3 データベース内の鉱山
8 データベース内のプラント
輸出規制が適用中。
Export licensing requirement for materials and technologies: Antimony (2024), bismuth (2025), synthesized diamond (2025), gallium (2023), germanium (2023), graphite (2023), indium (2025), magnesium materials (2024), molybdenum (2025), rare earths (2025), silver (2026), tellurium (2025), tungsten (2025), and items related to lithium batteries and artificial graphite anode materials (2025).
(USGS Mineral Commodity Summaries 2026, table 4 — as of January 2026)
生産物
地図 →USGS Mineral Commodity Summaries 2026 · 2025 (推定値) · 各行は、その商品について資料が使用している単位をそのまま使用しています · 出典 ↗
テーブルを横にスクロールすると残りの列が表示されます。
| 素材 | シリーズ | 生産 | 単位 | 世界に占める割合 |
|---|---|---|---|---|
| Cement | Cement production | 1,700,000 | thousand metric tons | 44.7% |
| Graphite | Mine production | 1,400,000 | metric tons | 77.8% |
| Gallium | Primary production | 900,000 | kilograms | 100.0% |
| Wollastonite | Mine production | 600,000 | metric tons | 69.8% |
| Lime | Production | 310,000 | thousand metric tons | 73.8% |
| Garnet (Industrial) | Mine production | 280,000 | metric tons | 38.4% |
| Rare Earths (all) | Mine production | 270,000 | metric tons | 69.2% |
| Titanium | Titanium sponge metal production | 260,000 | metric tons | 70.3% |
| Asbestos | Mine production | 250,000 | metric tons | 26.0% |
| Zeolites (Natural) | Mine production | 150,000 | metric tons | 11.5% |
| Nickel | Mine production | 120,000 | metric tons | 3.1% |
| Phosphate Rock | Mine production | 110,000 | thousand metric tons | 44.0% |
| Molybdenum | Mine production | 97,000 | metric tons | 37.3% |
| Alumina | Alumina, refinery production | 93,000 | thousand metric dry tons | 62.0% |
| Industrial Sand & Gravel | Mine production | 92,000 | thousand metric tons | 21.4% |
| Bromine | Production | 90,000 | metric tons | 20.9% |
| Bauxite | Bauxite, mine production | 87,000 | thousand metric dry tons | 19.8% |
| Vanadium | Mine production | 82,000 | metric tons | 74.5% |
| Strontium | Mine production | 80,000 | metric tons | 17.8% |
| Tin | Mine production | 71,000 | metric tons | 24.5% |
| Tungsten | Mine production | 67,000 | metric tons | 78.8% |
| Lithium | Mine production | 62,000 | metric tons | 21.4% |
| Salt | Mine production | 56,000 | thousand metric tons | 20.7% |
| Nitrogen (Ammonia) | Plant production | 49,000 | thousand metric tons | 30.6% |
| Aluminium | Smelter production | 45,000 | thousand metric tons | 60.8% |
| Antimony | Mine production | 40,000 | metric tons | 36.4% |
| Arsenic | Production (arsenic trioxide, gross weight) | 24,000 | metric tons | 39.3% |
| Rhenium | Mine production | 20,000 | kilograms | 24.7% |
| Sulfur | Production, all forms | 19,000 | thousand metric tons | 22.6% |
| Bismuth | Refinery production | 14,000 | metric tons | 87.5% |
| Magnesium Compounds | Mine production | 12,700 | thousand metric tons | 60.5% |
| Gypsum | Mine production | 12,000 | thousand metric tons | 7.5% |
| Cadmium | Refinery production | 9,500 | metric tons | 41.3% |
| Potash | Mine production | 6,300 | thousand metric tons | 12.9% |
| Fluorspar | Mine production | 6,000 | thousand metric tons | 60.0% |
| Zinc | Mine production | 4,100 | thousand metric tons | 31.5% |
| Feldspar & Nepheline Syenite | Mine production | 3,700 | thousand metric tons | 11.9% |
| Silicon | Ferrosilicon | 3,500 | thousand metric tons | 70.0% |
| Silver | Mine production | 3,400 | metric tons | 13.1% |
| Barite | Mine production | 2,200 | thousand metric tons | 25.3% |
| Cobalt | Mine production | 2,000 | metric tons | 0.6% |
| Selenium | Refinery production | 2,000 | metric tons | 52.6% |
| Lead | Mine production | 1,900 | thousand metric tons | 42.2% |
| Copper | Mine production | 1,800 | thousand metric tons | 7.8% |
| Perlite | Production | 1,500 | thousand metric tons | 32.6% |
| Magnesium Metal | Smelter production | 950.0 | thousand metric tons | 86.4% |
| Tellurium | Refinery production | 800.0 | metric tons | 80.0% |
| Indium | Refinery production | 760.0 | metric tons | 69.1% |
| Manganese | Mine production | 700.0 | thousand metric tons | 3.5% |
| Gold | Mine production | 380.0 | metric tons | 11.5% |
| Mercury | Mine production | 200.0 | metric tons | 95.2% |
| Diatomite | Mine production | 140.0 | thousand metric tons | 5.6% |
| Zirconium | Zirconium mineral concentrates, mine production (thousand metric tons, gross weight) | 100.0 | thousand metric tons | 8.3% |
| Tantalum | Mine production | 80.00 | metric tons | 3.2% |
| Beryllium | Mine production | 77.00 | metric tons | 17.9% |
| Vermiculite | Mine production | 40.00 | thousand metric tons | 8.7% |
| Niobium | Mine production | 40.00 | metric tons | 0.0% |
| Helium | Helium Production | 3.00 | million cubic meters | 1.6% |
留保している内容
USGS Mineral Commodity Summaries 2026 · 直近公表の埋蔵量
| 素材 | シリーズ | 埋蔵量 | 単位 | 世界に占める割合 |
|---|---|---|---|---|
| Graphite | Reserves | 100,000,000 | metric tons | 32.3% |
| Rare Earths (all) | Reserves | 44,000,000 | metric tons | 51.8% |
| Garnet (Industrial) | Reserves | 37,000,000 | metric tons | — |
| Strontium | Reserves | 12,000,000 | metric tons | — |
| Asbestos | Reserves | 7,100,000 | metric tons | 4.7% |
| Niobium | Reserves | 6,500,000 | metric tons | 31.0% |
| Lithium | Reserves | 4,600,000 | metric tons | 12.4% |
| Nickel | Reserves | 4,400,000 | metric tons | 3.1% |
| Phosphate Rock | Reserves | 3,400,000 | thousand metric tons | 4.7% |
| Tungsten | Reserves | 2,500,000 | metric tons | 53.2% |
| Gypsum | Reserves | 1,800,000 | thousand metric tons | — |
| Tin | Reserves | 1,200,000 | metric tons | 20.0% |
| Antimony | Reserves | 830,000 | metric tons | 41.5% |
| Feldspar & Nepheline Syenite | Reserves | 730,000 | thousand metric tons | — |
| Bauxite | Bauxite reserves | 710,000 | thousand metric dry tons | 2.4% |
| Magnesium Compounds | Reserves | 700,000 | thousand metric tons | 9.0% |
| Manganese | Reserves | 260,000 | thousand metric tons | 15.3% |
| Tantalum | Reserves | 240,000 | metric tons | — |
| Rhenium | Reserves | 200,000 | kilograms | — |
| Cobalt | Reserves | 160,000 | metric tons | 1.3% |
| Bromine | Reserves | 130,000 | metric tons | — |
| Barite | Reserves | 120,000 | thousand metric tons | — |
| Diatomite | Reserves | 120,000 | thousand metric tons | — |
| Fluorspar | Reserves | 110,000 | thousand metric tons | 33.3% |
| Silver | Reserves | 67,000 | metric tons | 11.0% |
| Zinc | Reserves | 60,000 | thousand metric tons | 25.0% |
| Copper | Reserves | 41,000 | thousand metric tons | 4.2% |
| Perlite | Reserves | 32,000 | thousand metric tons | — |
| Lead | Reserves | 22,000 | thousand metric tons | 23.2% |
| Molybdenum | Reserves (thousand metric tons) | 7,800 | thousand metric tons | 45.9% |
| Vanadium | Reserves | 5,800 | metric tons | 27.6% |
| Gold | Reserves | 3,200 | metric tons | 4.8% |
| Vermiculite | Reserves | 2,900 | thousand metric tons | — |
| Zirconium | Zirconium reserves(thousand metric tons, ZrO2 content) | 500.0 | thousand metric tons | 0.7% |
| Potash | Reserves, Recoverable ore | Not applicable | thousand metric tons | — |
| Helium | Helium Reserves | Not applicable | million cubic meters | — |
データベース内の鉱山
すべて →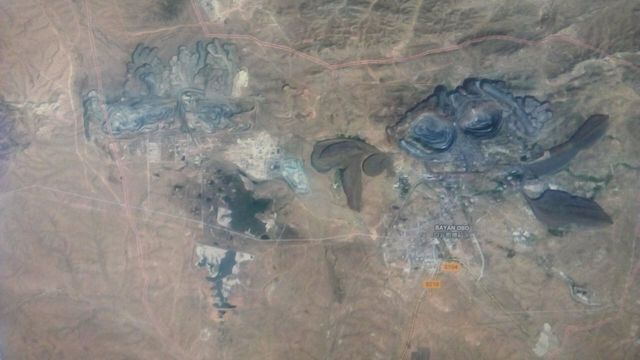
Bayan Obo
The largest rare-earth deposit in the world.
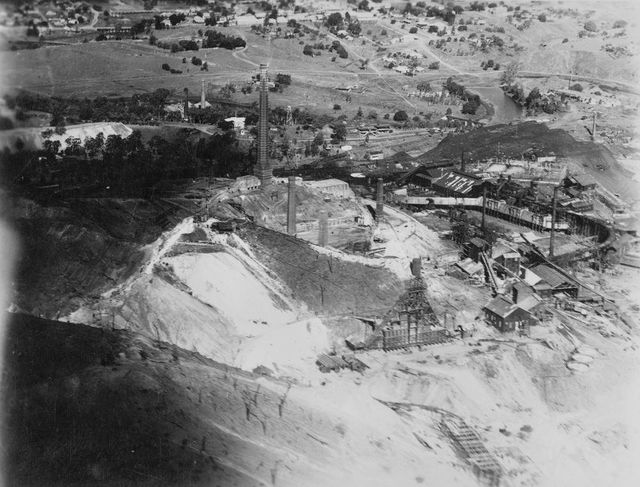
Southern China Ion-Adsorption Clays
Historically the dominant world source of heavy rare earths.
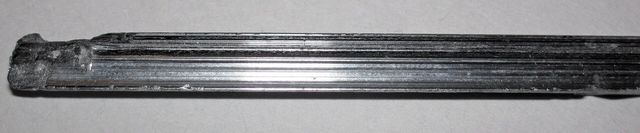
Xikuangshan
The largest antimony deposit in the world, often called the 'antimony capital'.
処理・製造施設
CATL Ningde Plants · GigafactoryChinese NdFeB Magnet Cluster · Magnet plantGuixi Smelter · SmelterGanzhou Rare Earth Cluster · Separation plantHuayou Cobalt Refineries · Chemical plantJinchuan Group Smelter-Refinery · RefineryQinghai & Sichuan Lithium Chemical Cluster · Chemical plantXinjiang & Inner Mongolia Polysilicon Cluster · Chemical plantここを通過する輸送経路 China
すべての輸送経路 →ここで採掘され、ここで精製され、あるいは他の目的地へ向かう途中で単純に国境を越える素材。
Southern Chinese clay to the dysprosium that lets a magnet run hot ここから始まる Grades under a tenth of a percent, and almost the only heavy rare earths on the market. A quarry in North Carolina to the chip in your phone The most valuable sand on Earth, and almost all of it comes from one small district. Australian rare earths to a magnet in a motor Mined in Australia, cracked in Malaysia, magnetised in China, and fitted in Germany. Australian spodumene to a battery, the fast way Eight weeks instead of eighteen months, at the cost of a great deal more energy. Chilean brine to a battery in a car The ore is water. The first year and a half of processing is done by the sun, for free. Chilean sulfide concentrate to Chinese cathode to a wire Chile mines the most copper in the world. China refines the most. Those are not the same sentence. Congolese cobalt to a battery cathode A metal almost nobody mines on purpose, carried out of a landlocked country by truck. Congolese oxide ore to finished cathode, without a smelter When the ore is oxide, acid will do what a smelter would otherwise have to. Guinean bauxite to an aluminium window frame Four tonnes of tropical soil, two tonnes of white powder, one tonne of metal — and the metal is made wherever the power is… Indonesian laterite to a battery cathode A country that banned raw ore exports and built the processing industry instead. Pilbara iron ore to Chinese steel The largest material flow on Earth: dig it, crush it, screen it, and put it on a boat.米国の主要輸入源(対象品目:
AluminiumArsenicBariteBismuthBromineCadmiumCaesiumDimension StoneFluorsparGalliumGarnet (Industrial)GermaniumGraphiteIndiumMagnesium CompoundsPerliteRubidiumScandiumStrontiumTantalumTungstenYttrium
USGS Mineral Commodity Summaries 2026 · 主要な米国輸入元、2021〜2024年