Asia
China
이곳에서 채굴되는 것, 아직 매장된 것, 그리고 자산을 운영하는 주체.
58 생산 소재
3 데이터베이스 내 광산
8 데이터베이스 내 플랜트
수출 통제 시행 중.
Export licensing requirement for materials and technologies: Antimony (2024), bismuth (2025), synthesized diamond (2025), gallium (2023), germanium (2023), graphite (2023), indium (2025), magnesium materials (2024), molybdenum (2025), rare earths (2025), silver (2026), tellurium (2025), tungsten (2025), and items related to lithium batteries and artificial graphite anode materials (2025).
(USGS Mineral Commodity Summaries 2026, table 4 — as of January 2026)
생산물
지도 →USGS Mineral Commodity Summaries 2026 · 2025 (추정치) · 각 행은 해당 원자재에 대해 출처가 사용하는 단위를 유지 · 출처 ↗
나머지 열을 보려면 표를 옆으로 스크롤하십시오.
| 소재 | 계열 | 생산 | 단위 | 세계 비중 |
|---|---|---|---|---|
| Cement | Cement production | 1,700,000 | thousand metric tons | 44.7% |
| Graphite | Mine production | 1,400,000 | metric tons | 77.8% |
| Gallium | Primary production | 900,000 | kilograms | 100.0% |
| Wollastonite | Mine production | 600,000 | metric tons | 69.8% |
| Lime | Production | 310,000 | thousand metric tons | 73.8% |
| Garnet (Industrial) | Mine production | 280,000 | metric tons | 38.4% |
| Rare Earths (all) | Mine production | 270,000 | metric tons | 69.2% |
| Titanium | Titanium sponge metal production | 260,000 | metric tons | 70.3% |
| Asbestos | Mine production | 250,000 | metric tons | 26.0% |
| Zeolites (Natural) | Mine production | 150,000 | metric tons | 11.5% |
| Nickel | Mine production | 120,000 | metric tons | 3.1% |
| Phosphate Rock | Mine production | 110,000 | thousand metric tons | 44.0% |
| Molybdenum | Mine production | 97,000 | metric tons | 37.3% |
| Alumina | Alumina, refinery production | 93,000 | thousand metric dry tons | 62.0% |
| Industrial Sand & Gravel | Mine production | 92,000 | thousand metric tons | 21.4% |
| Bromine | Production | 90,000 | metric tons | 20.9% |
| Bauxite | Bauxite, mine production | 87,000 | thousand metric dry tons | 19.8% |
| Vanadium | Mine production | 82,000 | metric tons | 74.5% |
| Strontium | Mine production | 80,000 | metric tons | 17.8% |
| Tin | Mine production | 71,000 | metric tons | 24.5% |
| Tungsten | Mine production | 67,000 | metric tons | 78.8% |
| Lithium | Mine production | 62,000 | metric tons | 21.4% |
| Salt | Mine production | 56,000 | thousand metric tons | 20.7% |
| Nitrogen (Ammonia) | Plant production | 49,000 | thousand metric tons | 30.6% |
| Aluminium | Smelter production | 45,000 | thousand metric tons | 60.8% |
| Antimony | Mine production | 40,000 | metric tons | 36.4% |
| Arsenic | Production (arsenic trioxide, gross weight) | 24,000 | metric tons | 39.3% |
| Rhenium | Mine production | 20,000 | kilograms | 24.7% |
| Sulfur | Production, all forms | 19,000 | thousand metric tons | 22.6% |
| Bismuth | Refinery production | 14,000 | metric tons | 87.5% |
| Magnesium Compounds | Mine production | 12,700 | thousand metric tons | 60.5% |
| Gypsum | Mine production | 12,000 | thousand metric tons | 7.5% |
| Cadmium | Refinery production | 9,500 | metric tons | 41.3% |
| Potash | Mine production | 6,300 | thousand metric tons | 12.9% |
| Fluorspar | Mine production | 6,000 | thousand metric tons | 60.0% |
| Zinc | Mine production | 4,100 | thousand metric tons | 31.5% |
| Feldspar & Nepheline Syenite | Mine production | 3,700 | thousand metric tons | 11.9% |
| Silicon | Ferrosilicon | 3,500 | thousand metric tons | 70.0% |
| Silver | Mine production | 3,400 | metric tons | 13.1% |
| Barite | Mine production | 2,200 | thousand metric tons | 25.3% |
| Cobalt | Mine production | 2,000 | metric tons | 0.6% |
| Selenium | Refinery production | 2,000 | metric tons | 52.6% |
| Lead | Mine production | 1,900 | thousand metric tons | 42.2% |
| Copper | Mine production | 1,800 | thousand metric tons | 7.8% |
| Perlite | Production | 1,500 | thousand metric tons | 32.6% |
| Magnesium Metal | Smelter production | 950.0 | thousand metric tons | 86.4% |
| Tellurium | Refinery production | 800.0 | metric tons | 80.0% |
| Indium | Refinery production | 760.0 | metric tons | 69.1% |
| Manganese | Mine production | 700.0 | thousand metric tons | 3.5% |
| Gold | Mine production | 380.0 | metric tons | 11.5% |
| Mercury | Mine production | 200.0 | metric tons | 95.2% |
| Diatomite | Mine production | 140.0 | thousand metric tons | 5.6% |
| Zirconium | Zirconium mineral concentrates, mine production (thousand metric tons, gross weight) | 100.0 | thousand metric tons | 8.3% |
| Tantalum | Mine production | 80.00 | metric tons | 3.2% |
| Beryllium | Mine production | 77.00 | metric tons | 17.9% |
| Vermiculite | Mine production | 40.00 | thousand metric tons | 8.7% |
| Niobium | Mine production | 40.00 | metric tons | 0.0% |
| Helium | Helium Production | 3.00 | million cubic meters | 1.6% |
보유 매장량
USGS Mineral Commodity Summaries 2026 · 가장 최근에 공표된 매장량
| 소재 | 계열 | 매장량 | 단위 | 세계 비중 |
|---|---|---|---|---|
| Graphite | Reserves | 100,000,000 | metric tons | 32.3% |
| Rare Earths (all) | Reserves | 44,000,000 | metric tons | 51.8% |
| Garnet (Industrial) | Reserves | 37,000,000 | metric tons | — |
| Strontium | Reserves | 12,000,000 | metric tons | — |
| Asbestos | Reserves | 7,100,000 | metric tons | 4.7% |
| Niobium | Reserves | 6,500,000 | metric tons | 31.0% |
| Lithium | Reserves | 4,600,000 | metric tons | 12.4% |
| Nickel | Reserves | 4,400,000 | metric tons | 3.1% |
| Phosphate Rock | Reserves | 3,400,000 | thousand metric tons | 4.7% |
| Tungsten | Reserves | 2,500,000 | metric tons | 53.2% |
| Gypsum | Reserves | 1,800,000 | thousand metric tons | — |
| Tin | Reserves | 1,200,000 | metric tons | 20.0% |
| Antimony | Reserves | 830,000 | metric tons | 41.5% |
| Feldspar & Nepheline Syenite | Reserves | 730,000 | thousand metric tons | — |
| Bauxite | Bauxite reserves | 710,000 | thousand metric dry tons | 2.4% |
| Magnesium Compounds | Reserves | 700,000 | thousand metric tons | 9.0% |
| Manganese | Reserves | 260,000 | thousand metric tons | 15.3% |
| Tantalum | Reserves | 240,000 | metric tons | — |
| Rhenium | Reserves | 200,000 | kilograms | — |
| Cobalt | Reserves | 160,000 | metric tons | 1.3% |
| Bromine | Reserves | 130,000 | metric tons | — |
| Barite | Reserves | 120,000 | thousand metric tons | — |
| Diatomite | Reserves | 120,000 | thousand metric tons | — |
| Fluorspar | Reserves | 110,000 | thousand metric tons | 33.3% |
| Silver | Reserves | 67,000 | metric tons | 11.0% |
| Zinc | Reserves | 60,000 | thousand metric tons | 25.0% |
| Copper | Reserves | 41,000 | thousand metric tons | 4.2% |
| Perlite | Reserves | 32,000 | thousand metric tons | — |
| Lead | Reserves | 22,000 | thousand metric tons | 23.2% |
| Molybdenum | Reserves (thousand metric tons) | 7,800 | thousand metric tons | 45.9% |
| Vanadium | Reserves | 5,800 | metric tons | 27.6% |
| Gold | Reserves | 3,200 | metric tons | 4.8% |
| Vermiculite | Reserves | 2,900 | thousand metric tons | — |
| Zirconium | Zirconium reserves(thousand metric tons, ZrO2 content) | 500.0 | thousand metric tons | 0.7% |
| Potash | Reserves, Recoverable ore | Not applicable | thousand metric tons | — |
| Helium | Helium Reserves | Not applicable | million cubic meters | — |
데이터베이스 내 광산
전체 →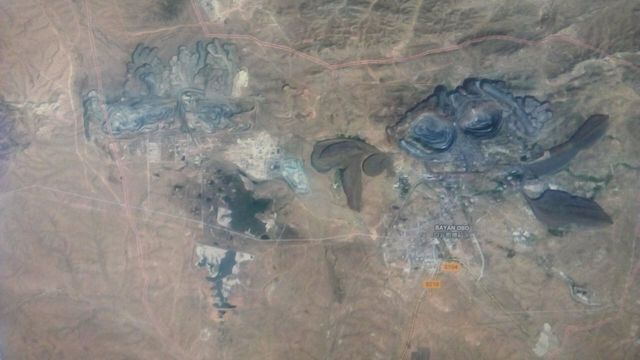
Bayan Obo
The largest rare-earth deposit in the world.
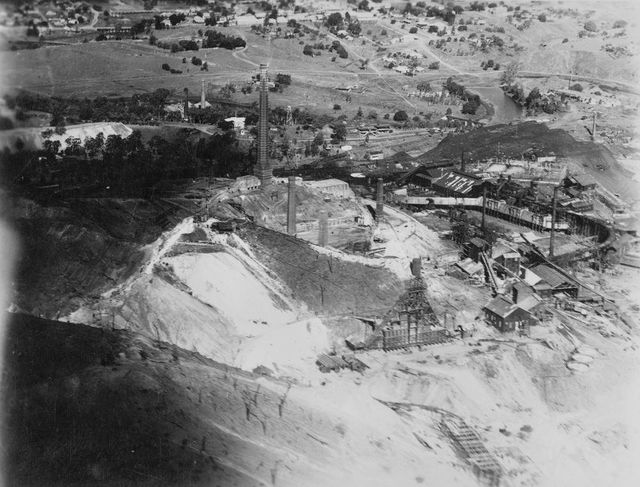
Southern China Ion-Adsorption Clays
Historically the dominant world source of heavy rare earths.
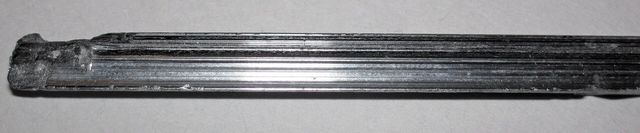
Xikuangshan
The largest antimony deposit in the world, often called the 'antimony capital'.
가공·제조 시설
CATL Ningde Plants · GigafactoryChinese NdFeB Magnet Cluster · Magnet plantGuixi Smelter · SmelterGanzhou Rare Earth Cluster · Separation plantHuayou Cobalt Refineries · Chemical plantJinchuan Group Smelter-Refinery · RefineryQinghai & Sichuan Lithium Chemical Cluster · Chemical plantXinjiang & Inner Mongolia Polysilicon Cluster · Chemical plant이곳을 통과하는 여정 China
모든 여정 →이곳에서 채굴되거나, 이곳에서 정제되거나, 또는 다른 목적지로 가는 도중 단순히 국경을 통과하는 소재.
Southern Chinese clay to the dysprosium that lets a magnet run hot 여기서 시작 Grades under a tenth of a percent, and almost the only heavy rare earths on the market. A quarry in North Carolina to the chip in your phone The most valuable sand on Earth, and almost all of it comes from one small district. Australian rare earths to a magnet in a motor Mined in Australia, cracked in Malaysia, magnetised in China, and fitted in Germany. Australian spodumene to a battery, the fast way Eight weeks instead of eighteen months, at the cost of a great deal more energy. Chilean brine to a battery in a car The ore is water. The first year and a half of processing is done by the sun, for free. Chilean sulfide concentrate to Chinese cathode to a wire Chile mines the most copper in the world. China refines the most. Those are not the same sentence. Congolese cobalt to a battery cathode A metal almost nobody mines on purpose, carried out of a landlocked country by truck. Congolese oxide ore to finished cathode, without a smelter When the ore is oxide, acid will do what a smelter would otherwise have to. Guinean bauxite to an aluminium window frame Four tonnes of tropical soil, two tonnes of white powder, one tonne of metal — and the metal is made wherever the power is… Indonesian laterite to a battery cathode A country that banned raw ore exports and built the processing industry instead. Pilbara iron ore to Chinese steel The largest material flow on Earth: dig it, crush it, screen it, and put it on a boat.미국의 주요 수입원
AluminiumArsenicBariteBismuthBromineCadmiumCaesiumDimension StoneFluorsparGalliumGarnet (Industrial)GermaniumGraphiteIndiumMagnesium CompoundsPerliteRubidiumScandiumStrontiumTantalumTungstenYttrium
USGS Mineral Commodity Summaries 2026 · 미국의 주요 수입국, 2021–2024